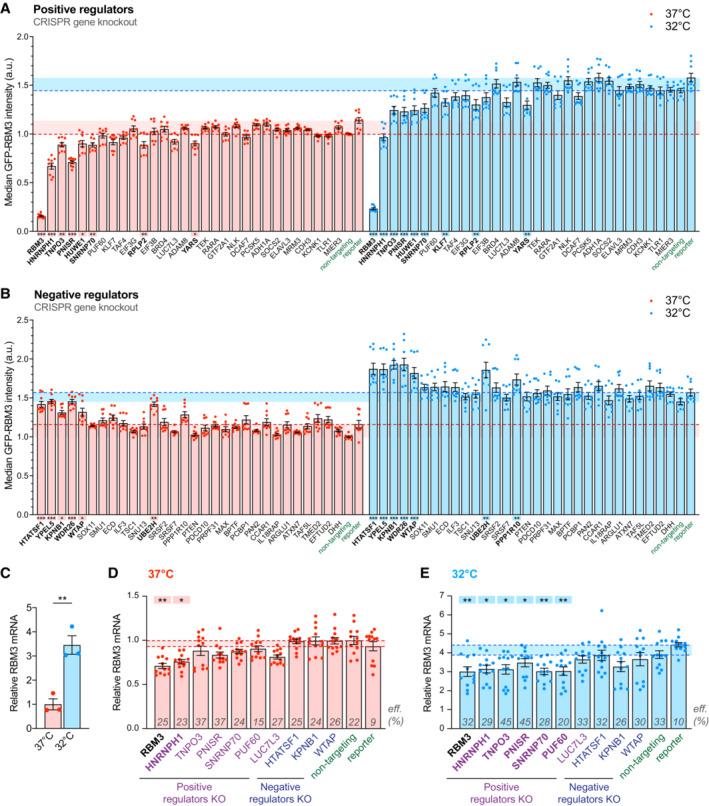
Figure 2. Depleting RBM3 positive regulators that function in RNA splicing reduces RBM3 protein and mRNA levels. See also Fig EV2 .

-
A, BMedian GFP intensity of BFP‐positive GFP‐RBM3 i‐neurons measured by flow cytometry upon the sgRNA/Cas9‐mediated KO of top 30 positive (A) or negative (B) regulator candidates. Statistical analysis is performed between the specific and non‐targeting sgRNA groups for positive regulators (A) or between the specific sgRNA and reporter groups for negative regulators (B) within the 37 or 32°C (72 h) population.
-
CqRT‐PCR of RBM3 mRNA level normalised to 18 s rRNA in i‐neurons at 37 or 32°C (72 h).
-
D, EqRT‐PCR of RBM3 mRNA level normalised to 18 s rRNA in GFP‐RBM3 i‐neurons at 37°C (D) or 32°C for 72 h (E) transduced with lentivirus containing specific, non‐targeting sgRNA or the reporter. Statistical analysis is performed between the specific and non‐targeting sgRNA for negative regulators in (D) and positive regulators in (E), or between the specific and reporter groups for positive regulators in (D) and negative regulators in (E). Transduction efficiencies are indicated in corresponding bars.
Data information: N = 3 biological replicates. Each data point represents one well of culture. Mean ± SEM; *(P < 0.05), **(P < 0.01), ***(P < 0.001); One‐way ANOVA with multiple comparisons in (A), (B), (D), (E), unpaired t‐tests in (C).
Source data are available online for this figure.
