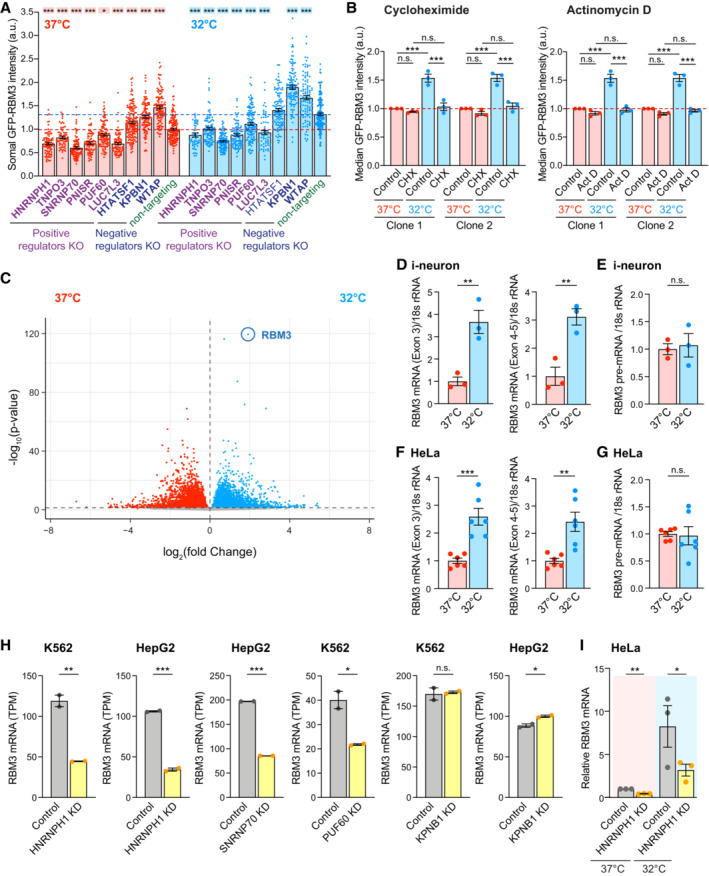
Figure EV2. Cooling and regulators involved in mRNA splicing change RBM3 transcript levels. Related to Fig 2 .

-
ASomal GFP intensity per unit area in GFP‐RBM3 i‐neurons transduced with lentivirus containing specific or non‐targeting sgRNA at 37 or 32°C (72 h) imaged by wide‐field microscopy. Only BFP‐positive (transduced) cells are included. Statistical analysis is performed between the specific and non‐targeting sgRNA within the temperature groups. Each data point represents one cell.
-
BMedian GFP intensity per unit area of GFP‐RBM3 i‐neurons at 37 or 32°C (72 h) treated with cycloheximide (CHX) at 50 μM for 72 h or actinomycin D (Act D) at 1 μM for 72 h.
-
CVolcano plot showing differential expression analysis of all transcripts identified in i‐neurons at 37 and 32°C (72 h) from RNA‐Seq data.
-
D, EqRT‐PCR of RBM3 Exon 3, Exon 4–5 (D) and pre‐mRNA (E) normalised to 18 s rRNA in i‐neurons at 37 and 32°C (72 h).
-
F, GqRT‐PCR of RBM3 Exon 3, Exon 4–5 (F) and pre‐mRNA (G) normalised to 18 s rRNA in HeLa cells at 37 and 32°C (48 h).
-
HNormalised RBM3 mRNA abundance (TPM) of control and selective regulator candidates knocked‐down K562 or HepG2 cells. Data are extracted from ENCODE project. 2 isogenic replicates are included in each condition.
-
IqRT‐PCR of RBM3 mRNA normalised to GAPDH in control and HNRNPH1 KD HeLa cells at 37 or 32°C (48 h).
Data information: N = 3 biological replicates. Mean ± SEM; n.s. (not significant), *(P < 0.05), **(P < 0.01), ***(P < 0.001); one‐way ANOVA with multiple comparisons in (A), unpaired t‐tests in (B), (D)‐(H); paired t‐test in (I).
Source data are available online for this figure.
