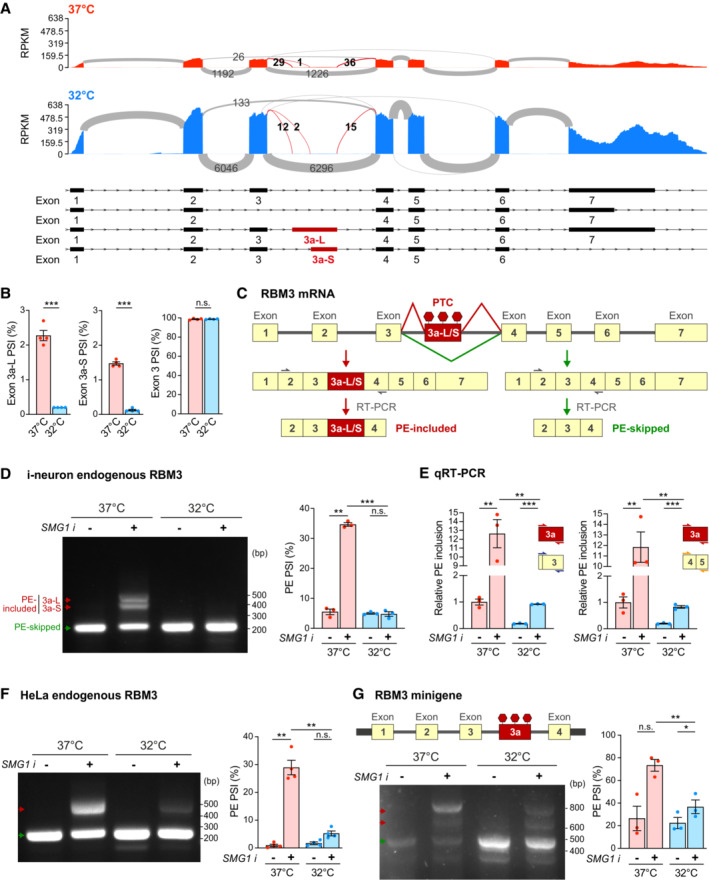
Figure 3. Hypothermia represses RBM3 mRNA poison exon inclusion. See also Fig EV3 .

- Sashimi plots of RBM3 transcripts in WT i‐neurons at 37 and 32°C (72 h), showing major alternatively spliced isoforms. Differentially spliced Exon 3a‐L and 3a‐S junctions between 37 and 32°C conditions are shown in red. N = 4.
- PSI values of RBM3 Exon 3a‐L and 3a‐S relative to Exon 3 and 4, and Exon 3 relative to Exon 2 and 4 in i‐neurons at 37 or 32°C (72 h).
- Schematics of RBM3 Exon 3a, or poison exon (PE), alternative splicing and the resulting PE‐included (left) or PE‐skipped (right) mRNA products. RT‐PCR primer pair amplifying Exon 2–4 are indicated by grey arrows.
- RT‐PCR of RBM3 mRNA (Exon 2–4) in i‐neurons at 37 or 32°C (72 h) in the presence or absence of SMG1 inhibitor. PSI values of RBM3 PE are calculated based on the intensity of PE‐included (red arrows) and PE‐skipped (green arrow) isoforms.
- qRT‐PCR using a combination of primers targeting Exon 3a, Exon 3 or Exon 4–5 quantifies the PSI values of RBM3 PE (Exon 3a, including both 3a‐L and 3a‐S) relative to Exon 3 or Exon 4–5 at 37 or 32°C (72 h) in the presence or absence of SMG1 inhibitor.
- RT‐PCR of RBM3 mRNA (Exon 2–4) in HeLa cells at 37 and 32°C (48 h) in the presence or absence of SMG1 inhibitor. PSI values of RBM3 PE are depicted in the graph on the right.
- Schematics and RT‐PCR of RBM3 minigene (Exon 1–4), flanked by unique sequences (thick black bars) to distinguish it from endogenous transcripts during PCR amplification, expressed in HeLa cells at 37 or 32°C (48 h), in the presence or absence of SMG1 inhibitor. PSI values of RBM3 PE are depicted in the graph on the right.
Data information: N = 4 biological replicates in (A), (B) and (F), N = 3 in (D), (E) and (G). Mean ± SEM; n.s. (not significant), *(P < 0.05), **(P < 0.01), ***(P < 0.001); FDR calculated by rMATS program in (B); unpaired t‐tests in (E); paired t‐tests in (D), (F), (G).
Source data are available online for this figure.
