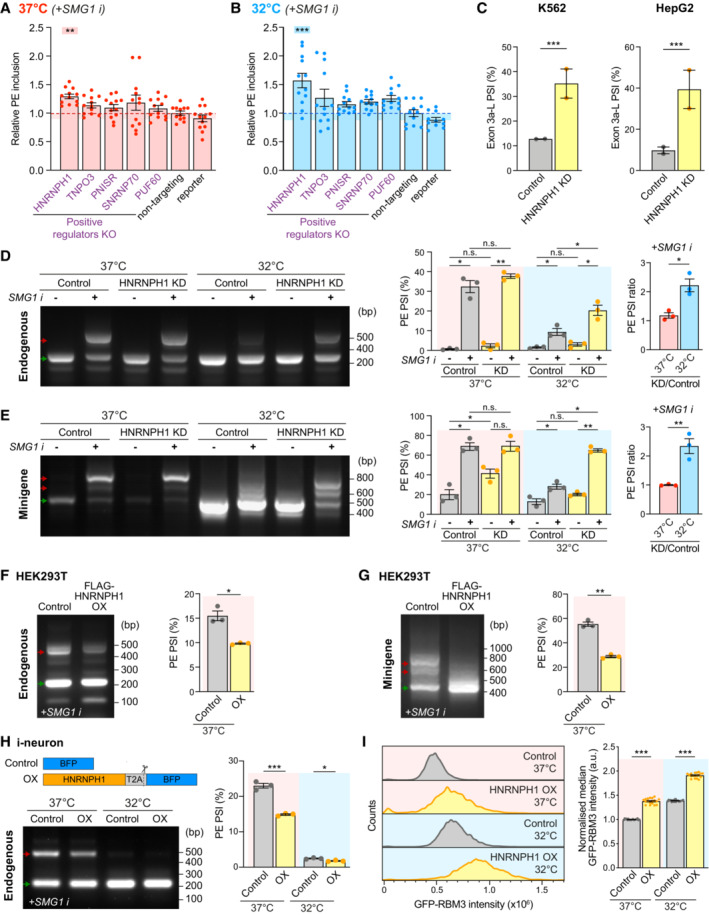
Figure 4. HNRNPH1 increases RBM3 expression by promoting poison exon skipping. See also Fig EV4 .

-
A, BqRT‐PCR quantifying the PSI values of RBM3 PE relative to RBM3 mRNA in WT i‐neurons at 37°C (A) or 32°C (72 h) (B), when NMD is blocked by SMG1 inhibitor. Statistical analysis is performed between the specific and non‐targeting sgRNA groups.
-
CPSI values of RBM3 Exon 3a‐L in control and HNRNPH1‐knocked down K562 and HepG2 cells. RNA‐Seq data from ENCODE Project, 2 isogenic replicates are included.
-
D, ERT‐PCR of endogenous RBM3 (D) and expressed RBM3 minigene (E) in control (scramble siRNA) or HNRNPH1‐knocked down HeLa cells at 37 or 32°C (48 h), in the presence or absence of SMG1 inhibitor. The ratio of PSI values between HNRNPH1 KD and control is shown for only the SMG1 i‐treated conditions.
-
F, GRT‐PCR of endogenous RBM3 (F) and expressed RBM3 minigene (G) in SMG1 inhibitor‐treated control (untransfected) or FLAG‐HNRNPH1‐overexpressing (OX) HEK293T cells at 37°C. PSI values of RBM3 PE are shown in the graphs on the right respectively.
-
HWT i‐neurons are transduced with lentiviral constructs expressing BFP (Control) or HNRNPH1‐T2A‐BFP (HNRNPH1 overexpression, OX) at 37 and 32°C, followed by RT‐PCR of endogenous RBM3 with 24 h SMG1 inhibitor treatment. PSI values of RBM3 PE are shown in the graph on the right.
-
IGFP‐RBM3 intensity histogram and control (37°C)‐normalised median GFP intensity indicating GFP intensity of control and HNRNPH1‐overexpressing (OX) GFP‐RBM3 i‐neurons measured by flow cytometry. Only cells with top 5% BFP levels among all BFP‐positive cells in the well are included.
Data information: N = 3 biological replicates. Each data point represents one well of culture in (A) and (I). Mean ± SEM; n.s. (not significant), *(P < 0.05), **(P < 0.01), ***(P < 0.001); one‐way ANOVA with multiple comparisons in (A), (B); FDR calculated by rMATS program in (C), paired t‐tests in (D–G), unpaired t‐tests in (H), (I).
Source data are available online for this figure.
