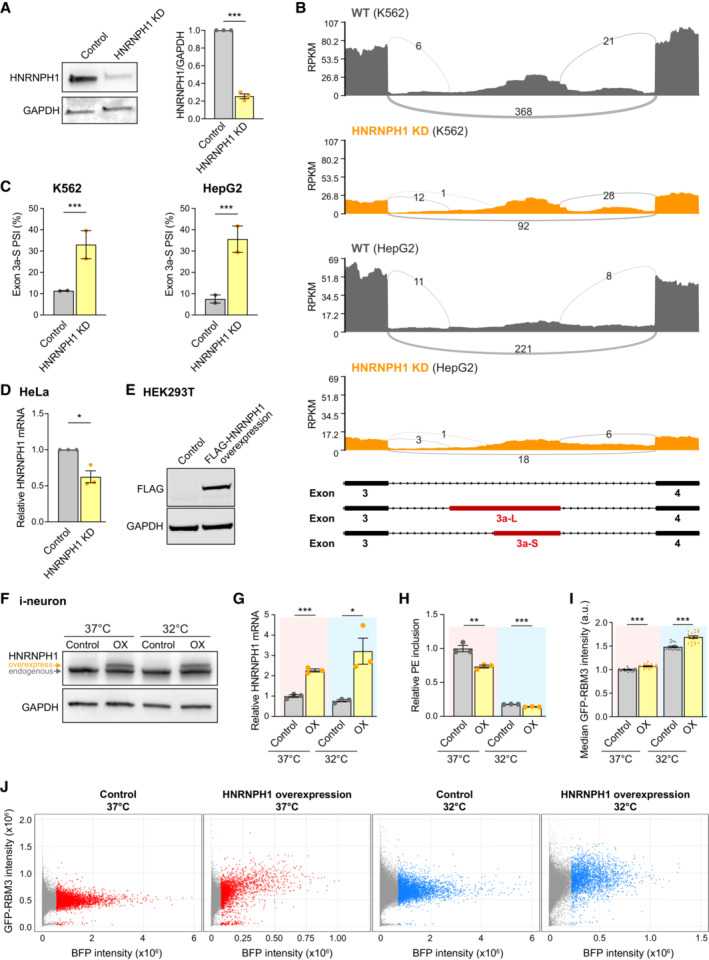
Figure EV4. HNRNPH1 enhances RBM3 expression and RBM3 mRNA poison exon skipping on cooling. Related to Fig 4 .

- Western blots and quantification of HNRNPH1 normalised to GAPDH in Control and HNRNPH1 KD Cas9WT i‐neurons.
- Sashimi plots of the region between Exon 3 and 4 of RBM3 transcripts in control and HNRNPH1 knocked‐down K562 and HepG2 cells, showing major alternatively spliced isoforms. Data are from ENCODE Project. 2 isogenic replicates are included.
- PSI values of RBM3 Exon 3a‐S in control and HNRNPH1‐knocked down K562 and HepG2 cells. RNA‐Seq data from ENCODE Project, 2 isogenic replicates are included.
- qRT‐PCR of HNRNPH1 mRNA normalised to GAPDH upon HNRNPH1 KD in HeLa cells.
- Western blots of FLAG‐HNRNPH1 and GAPDH (loading control) in control and FLAG‐HNRNPH1‐expressed HEK293T cells at 37°C.
- Western blot of WT i‐neurons transduced with lentivirus expressing BFP (control) or HNRNPH1‐T2A‐BFP (OX) at 37 and 32°C. The larger molecular weight of overexpressed HNRNPH1 is due to the additional amino acids between the C‐terminus of HNRNPH1 and the T2A cleavage site.
- qRT‐PCR of HNRNPH1 mRNA normalised to 18 s rRNA of WT i‐neurons transduced with lentivirus expressing BFP (control) or HNRNPH1‐T2A‐BFP (OX) at 37 and 32°C.
- qRT‐PCR quantifying the PSI values of RBM3 PE relative to RBM3 mRNA (mean value of RBM3 exon 3 and exon 4–5) in SMG1 inhibitor‐treated control and HNRNPH1‐overexpressing (OX) WT i‐neurons at 37 and 32°C.
- Median GFP intensity of control and HNRNPH1‐overexpressing (OX) GFP‐RBM3 i‐neurons measured by flow cytometry.
- Representative dot plots of flow cytometry data showing BFP or HNRNPH1‐T2A‐BFP expression (X‐axis) and GFP intensity of successfully transduced (BFP‐positive) GFP‐RBM3 i‐neurons. Each data point represents one cell. Cells with high levels of BFP expression (top 5% in each well) are coloured in red (37°C) or blue (32°C), and the rest of BFP‐positive cells are in grey. Y‐axes are in the same scale and X‐axes are scaled to the sample.
Data information: N = 3 biological replicates. Mean ± SEM; n.s. (not significant), *(P < 0.05), **(P < 0.01), ***(P < 0.001); unpaired t‐tests in (A), (G), (H), (I), FDR calculated by rMATS program in (C), paired t‐test in (D).
Source data are available online for this figure.
