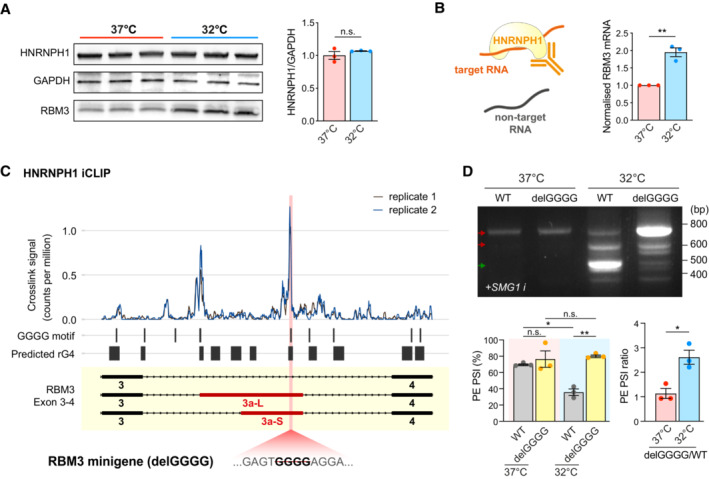
Figure 5. HNRNPH1 interacts with G‐rich sequences in RBM3 poison exon in a temperature‐dependent manner. See also Fig EV5 .

- Western blot and quantification of HNRNPH1 normalised to GAPDH in WT i‐neurons at 37 and 32°C (72 h). RBM3 blots of the same samples are shown for comparison.
- Schematic of HNRNPH1 RNA Immunoprecipitation (RIP) in HeLa cells at 37 or 32°C. The graph on the right shows the fold change in HNRNPH1‐pulled down RBM3 mRNA after normalisation.
- Analysis of public HNRNPH1 iCLIP dataset in two replicates, mapped to RBM3 Exon 3–4. Crosslink counts are normalised to library size. RNA G quadruplexes (rG4) are predicted using QGRS mapper. The position of the GGGG motif deleted in the mutant RBM3 minigene is shown in pink.
- RT‐PCR of WT and delGGGG RBM3 minigenes in HeLa cells at 37 or 32°C (48 h) treated with SMG1 inhibitor. PSI values of RBM3 PE are shown in the graphs on the right.
Data information: N = 3 biological replicates. Mean ± SEM; n.s. (not significant), *(P < 0.05), **(P < 0.01); unpaired t‐tests in (A), (B), (F), paired t‐tests in (D).
Source data are available online for this figure.
