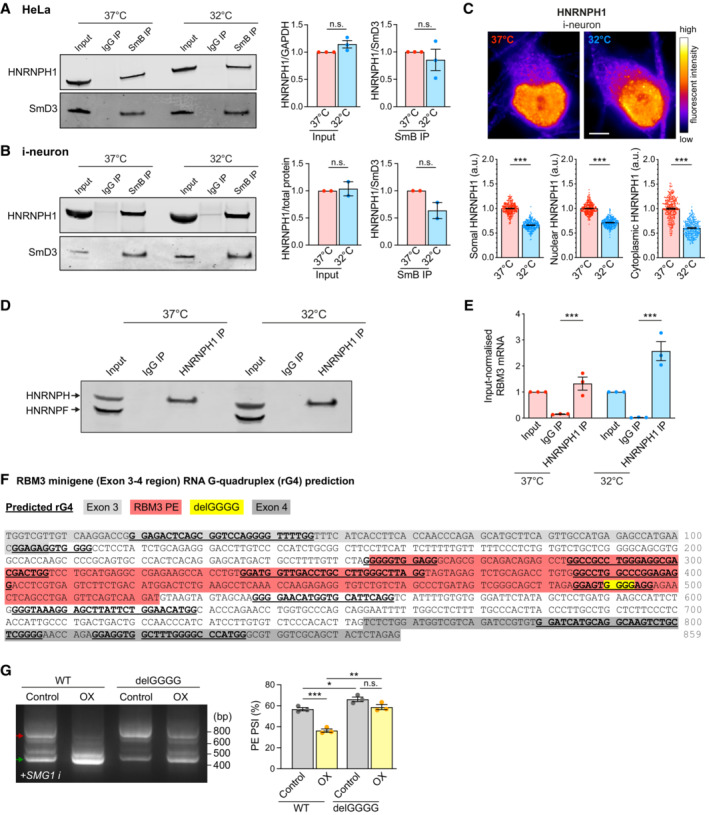
Figure EV5. HNRNPH1 interacts with G‐rich sequences in RBM3 poison exon in a temperature‐dependent manner. Related to Fig 5 .

- Western blot and quantification of HNRNPH1 total protein levels (input HNRNPH1 normalised to GAPDH) and its abundance in spliceosomal protein SmB pulldown (normalised to spliceosomal protein SmD3) in HeLa cells at 37 and 32°C (72 h).
- Western blot and quantification of HNRNPH1 total protein levels (input HNRNPH1 normalised to ponceau measured total protein abundance) and its abundance in spliceosomal protein SmB pulldown (normalised to spliceosomal protein SmD3) in i‐neurons at 37 and 32°C (72 h).
- Representative images of HNRNPH1 staining of GFP‐RBM3 i‐neurons at 37°C or after 72 h cooling at 32°C. Graphs below the images show quantification of somal, nuclear and cytoplasmic intensity per unit area respectively. The decrease of HNRNPH1 signals at 32°C is due to the global attenuation of protein production, which is not seen after total protein or GAPDH normalisation in western blot in (B) and Fig 4A. N = 280 (37°C) and 262 (32°C) cells. Scale bar: 5 μm.
- Western blot of HNRNPH/F in HeLa cell input (total) lysate, IgG‐pulled down and HNRNPH1‐pulled down eluates at 37 and 32°C (48 h).
- Quantification of input‐normalised RBM3 mRNA levels in HeLa cell input (total), IgG‐pulled down and HNRNPH1‐pulled down RNA at 37 and 32°C (48 h).
- RNA G quadruplexes (rG4) within the RBM3 Exon 3–4 region are predicted using QGRS mapper. Deletion of the GGGG motif in the mutant RBM3 minigene is predicted to disrupt the rG4 structure overlapping this region.
- RT‐PCR of WT and delGGGG RBM3 minigenes in control or HNRNPH1‐overexpressing (OX) HEK293T cells treated with SMG1 inhibitor at 37°C. PSI values of RBM3 PE are shown in the graphs on the right.
Data information: N = 3 biological replicates, except (B), which has N = 2. Mean ± SEM; n.s. (not significant), *(P < 0.05), **(P < 0.01), ***(P < 0.001); paired t‐test in (A), (B), (E), (G), unpaired t‐tests in (C).
Source data are available online for this figure.
