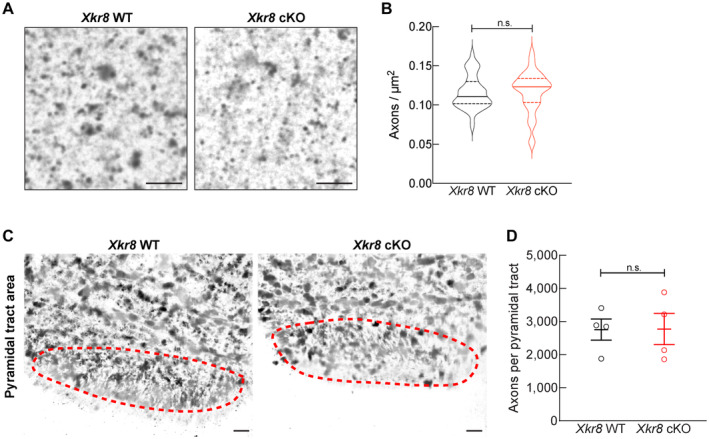
Figure EV5. The density of corticospinal axons in the medulla of P0 Xkr8 WT and cKO mouse.

- Corticospinal axons of the pyramidal tracts in medulla of P0 Xkr8 WT and cKO mice were visualized by Palmgren staining in high magnification (60×) to quantify axonal density; scale bar 4 μm.
- Corticospinal axon density (Mann–Whitney test, n = 4 mice per genotype, the data are presented as median and quartiles).
- Corticospinal axons of the pyramidal tracts in medulla of P0 Xkr8 WT and cKO mice were visualized by Palmgren staining in low magnification (20×) to measure pyramidal tract area, delineated by dashed lines; scale bar 20 μm.
- Corticospinal axon count per whole pyramidal tract area (two‐tailed Student's t‐test, n = 4 mice per genotype, the data are presented as mean ± SEM).
Source data are available online for this figure.
