
Figure 7. Increased global functional connectivity in Xkr8 knockout.
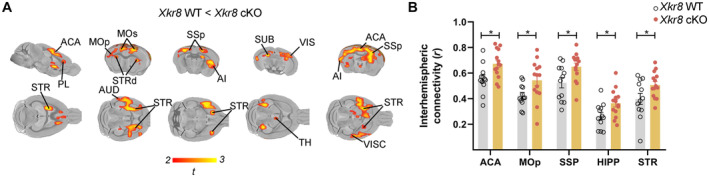
- Brain regions with significantly increased functional connectivity in Xkr8 cKO mice compared to Xkr8 WT mice as identified by seed‐based mapping of rsfMRI networks (t‐test, P < 0.05 FWE cluster‐corrected, with cluster‐defining threshold of t 24 > 2.07, P < 0.05; for seed placement see Appendix Fig S5). Colored regions represent the areas of the brain exhibiting increased functional connectivity in Xkr8 cKO compared to Xkr8 WT brains; color scale represents the level of functional correlation; abbreviations specify anatomical designations of identified regions.
- Inter‐hemispheric connectivity in representative brain volumes of interest in Xkr8 WT and cKO mice. Regional quantification was performed by computing regional fMRI correlation between the right and left hemisphere. The analysis revealed increased inter‐hemispheric connectivity in Xkr8 cKO brains compared to Xkr8 WT (two‐tailed Student's t‐test, each dot represents an individual mouse, n = 12–14 per genotype; data presented as mean ± SEM, *P < 0.05).
Data information: ACA: anterior cingulate cortex, AI: agranular insular area, AUD: auditory areas, HIPP: hippocampus, MOp: primary motor area, MOs: secondary motor area, PL: prelimbic area, SSp: primary somatosensory area, STR: striatum, STRd: striatum dorsal region, SUB: subiculum, TH: thalamus, VIS: visual areas, VISC: visceral area.
Source data are available online for this figure.