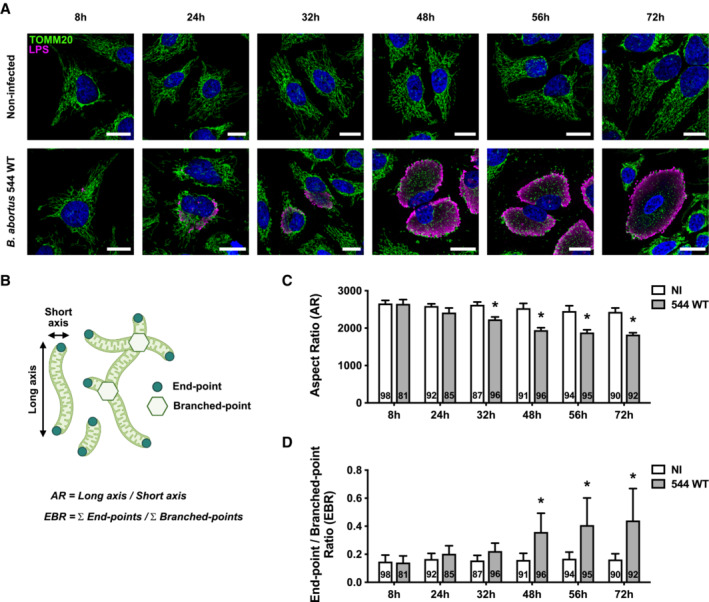
Figure 1. B. abortus triggers mitochondrial network fragmentation during the late steps of infection in HeLa cells.

-
ARepresentative confocal micrographs of HeLa cells infected or not with B. abortus 544 for the indicated times, then fixed and immunostained for TOMM20 (Alexa Fluor 488—green) and B. abortus LPS (Alexa Fluor 568—Magenta). DNA was stained with Hoechst 33258 (blue). Scale bars: 20 μm.
-
BSchematic summary of the calculation of the aspect ratio (AR) and the end‐point/branched‐point ratio (EBR) of the mitochondrial network. See the “Quantification of mitochondrial network morphology” paragraph in the Methods section for further information. Created with Biorender.com.
-
C, DQuantification of the mitochondrial population morphology by assessing the AR (C) and EBR (D) of the mitochondria of HeLa cells infected or not (NI) with B. abortus 544 for the indicated times from micrographs shown in (A). Data are presented as means ± SD from n = 5 (biological replicates) independent experiments (the numbers indicated in the columns represent the number of cells analysed per condition). Statistical analyses were performed using a multiple Mann–Whitney test followed by a Holm‐Šidàk's multiple comparisons test; asterisks indicate significant differences compared to the control (NI); *P < 0.05.
Source data are available online for this figure.
