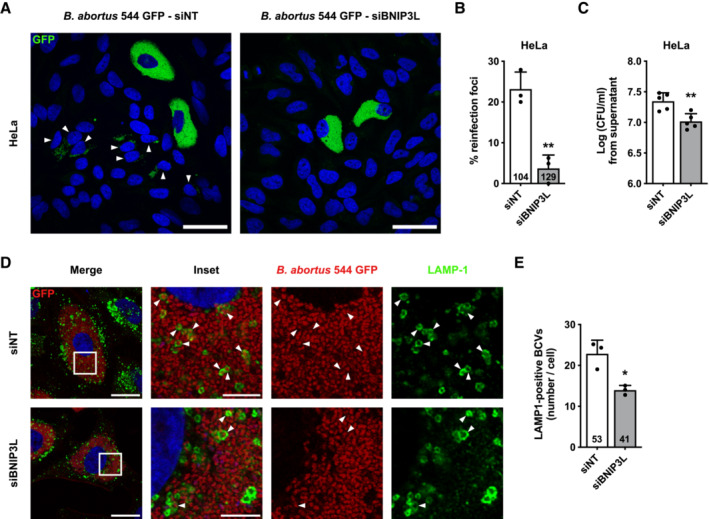
Figure 6. BNIP3L depletion limits aBCV formation and prevents reinfection events in HeLa cells.

-
ARepresentative confocal micrographs of HeLa cells infected with B. abortus 544 GFP (green) and transfected with a non‐targeting siRNA pool (siNT—40 nM) or a BNIP3L siRNA SMARTpool (siBNIP3L—40 nM) for 48 h, then incubated under reinfection‐permissive conditions for 24 h before analysis at 72 h pi. Cells were fixed and DNA was stained with Hoechst 33258 (blue). Arrows indicate reinfected cells. Scale bars: 50 μm.
-
BQuantification of the percentages of reinfection foci per infected cell at 72 h pi of HeLa cells from micrographs shown in (A). Data are presented as means ± SD from n = 3 (biological replicates) independent experiments (the numbers indicated in the columns represent the number of cells analysed per condition). Statistical analyses were performed using an unpaired two‐tailed Student's t‐test; **P < 0.01 (P = 0.0032).
-
CCFU assay expressing Log (CFU/ml) from the supernatant of HeLa cells infected with B. abortus 544 GFP (green) that were previously transfected with a non‐targeting siRNA pool (siNT—40 nM) or a BNIP3L siRNA SMARTpool (siBNIP3L—40 nM) for 48 h, then incubated under reinfection‐permissive conditions for 24 h before collecting the supernatant at 72 h pi for analysis. Data are presented as means ± SD from n = 5 (biological replicates) independent experiments; Statistical analyses were performed using an unpaired two‐tailed Student's t‐test; **P < 0.01 (P = 0.0042).
-
DRepresentative confocal micrographs of HeLa cells infected with B. abortus 544 GFP (Red) and transfected with a non‐targeting siRNA pool (siNT—40 nM) or a BNIP3L siRNA SMARTpool (siBNIP3L—40 nM) for 72 h pi, then fixed and immunostained for LAMP‐1 (Alexa Fluor 568—green). DNA was stained with Hoechst 33258 (blue). Arrows indicate LAMP‐1‐positive BCVs (aBCVs). Scale bars: 20 μm. Inset scale bars: 5 μm.
-
EQuantification of the number of LAMP‐1‐positive BCVs (aBCVs) per infected HeLa cells from micrographs shown in (E). Data are presented as means ± SD from n = 3 (biological replicates) independent experiments (the numbers indicated in the columns represent the number of cells analysed per condition). Statistical analyses were performed using an unpaired two‐tailed Student's t‐test; *P < 0.05 (P = 0.0117).
Source data are available online for this figure.
