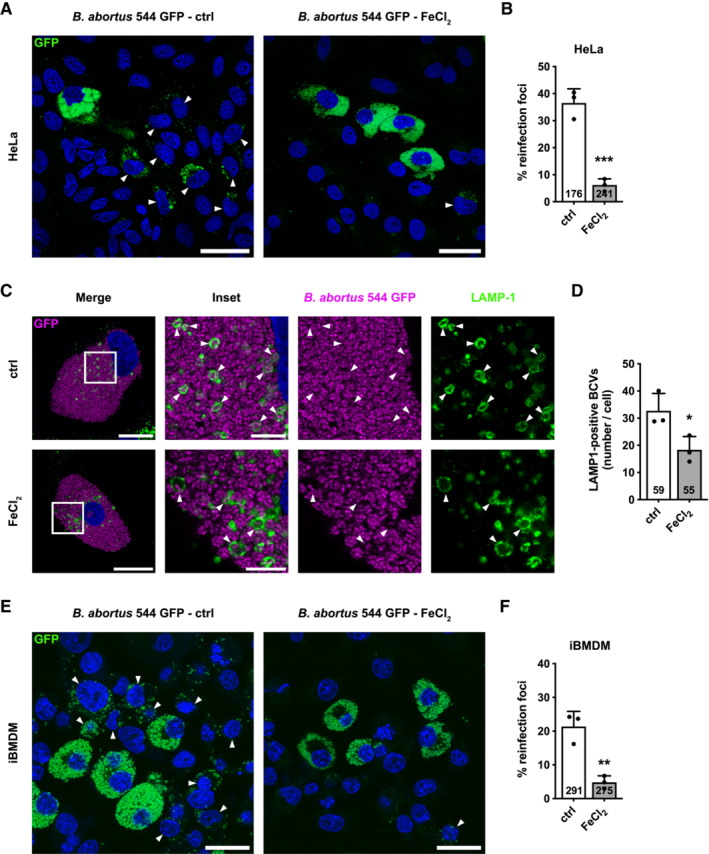
Figure 7. Iron limits aBCV formation and prevents reinfection events in HeLa cells and iBMDM.

-
ARepresentative confocal micrographs of HeLa cells infected with B. abortus 544 GFP (Green) treated or not (ctrl) with FeCl2 (500 μM) for 48 h, then incubated under reinfection‐permissive conditions (with or without FeCl2) for 24 h before analysis at 72 h pi. Cells were fixed and DNA was stained with Hoechst 33258 (blue). Arrows indicate reinfected cells. Scale bars: 50 μm.
-
BQuantification of the percentages of reinfection foci per infected cell at 72 h pi of HeLa cells from micrographs shown in (A). Data are presented as means ± SD from n = 3 (biological replicates) independent experiments (the numbers indicated in the columns represent the number of cells analysed per condition). Statistical analyses were performed using an unpaired two‐tailed Student's t‐test; ***P < 0.001 (P = 0.0008).
-
CRepresentative confocal micrographs of HeLa cells infected or not with B. abortus 544 GFP (Magenta) treated or not (ctrl) with FeCl2 (500 μM) for 72 h, then fixed and immunostained for LAMP‐1 (Alexa Fluor 568—green). DNA was stained with Hoechst 33258 (blue). Arrows indicate LAMP‐1‐positive BCVs (aBCVs). Scale bars: 20 μm. Inset scale bars: 5 μm.
-
DQuantification of the number of LAMP‐1‐positive BCVs (aBCVs) per infected HeLa cells from micrographs shown in (C). Data are presented as means ± SD from n = 3 (biological replicates) independent experiments (the numbers indicated in the columns represent the number of cells analysed per condition). Statistical analyses were performed using an unpaired two‐tailed Student's t‐test; *P < 0.05 (P = 0.0368).
-
ERepresentative confocal micrographs of iBMDM infected with B. abortus 544 GFP (Green) treated or not (ctrl) with FeCl2 (500 μM) for 48 h, then incubated under reinfection‐permissive conditions (with or without FeCl2) for 24 h before analysis at 72 h pi. Cells were fixed and DNA was stained with Hoechst 33258 (blue). Arrows indicate reinfected cells. Scale bars: 50 μm.
-
FQuantification of the percentages of reinfection foci per infected cell at 72 h pi of iBMDM from micrographs shown in (E). Data are presented as means ± SD from n = 3 (biological replicates) independent experiments (the numbers indicated in the columns represent the number of cells analysed per condition). Statistical analyses were performed using an unpaired two‐tailed Student's t‐test; **P < 0.01 (P = 0.0043).
Source data are available online for this figure.
