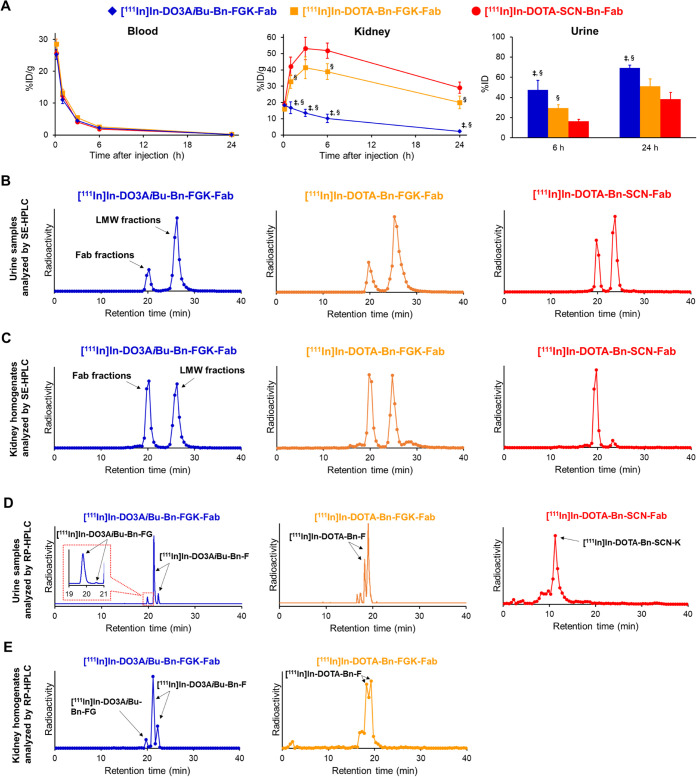
Figure 4.
(A) Comparative biodistribution of radioactivity after intravenous injection of three 111In-labeled Fabs in normal mice (n = 5). Significances were determined by one-way analysis of variance followed by Tukey’s test; p < 0.05 compared with [111In]In-DOTA-Bn-FGK-Fab (‡) and [111In]In-DOTA-Bn-SCN-Fab (§). (B) SE-HPLC elution profiles of urine samples collected by 6 h injection of the three 111In-labeled Fabs. (C) SE-HPLC elution profiles of kidney homogenates after 10 min injection. On SE-HPLC analyses, the intact Fabs were eluted at a retention time of around 20 min, while the radiometabolites were detected at a retention time of 22–31 min. (D) RP-HPLC elution profiles of urine samples collected by 6 h injection of three 111In-labeled Fabs in normal mice. (E) RP-HPLC elution profiles of kidney homogenates after 10 min injection. The arrows indicate the radioactivity peaks of radiometabolites identified with authentic compounds.

