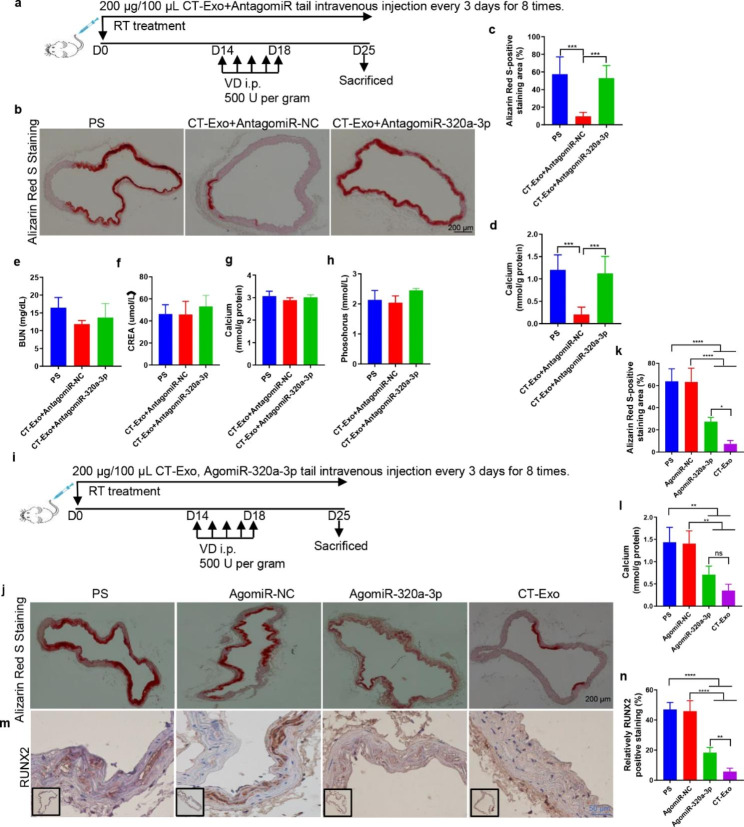
Fig. 6.
miR-320a-3p effectively protected against MAC in vivo and its related biochemical indicators. (a) Experimental design of the VD-induced vascular calcification mouse model treated with PBS, CT-Exo + AntagomiR-NC or CT-Exo + AntagomiR-320a-3p by intravenous injection (n = 6 per group). ARS staining and quantitation (b, c) and vascular calcium content measurement (d). The black scale bar is 200 μm. Serum BUN (e), CREA (f), calcium (g) and phosphate (h) levels in mice with VD-induced vascular calcification (n = 6). (i) Experimental design of the VD-induced vascular calcification mouse model treated with PBS, AgomiR-NC or AgomiR-320a-3p by intravenous injection (n = 6). ARS staining and quantitation (j, k) and vascular calcium content measurement (l). RUNX2 expression in the thoracic aorta (m) and quantitation of positive staining area (n) are shown. The black scale bar is 200 μm and the blue scale bar is 50 μm. The PS group represents the control group with only β-GP treatment. The data are presented as the mean ± standard deviation. The data were analysed with one-way ANOVA with the Bonferroni post hoc test. ns > 0.05; *p < 0.05; **p < 0.01; ***p < 0.001 and ****p < 0.0001

