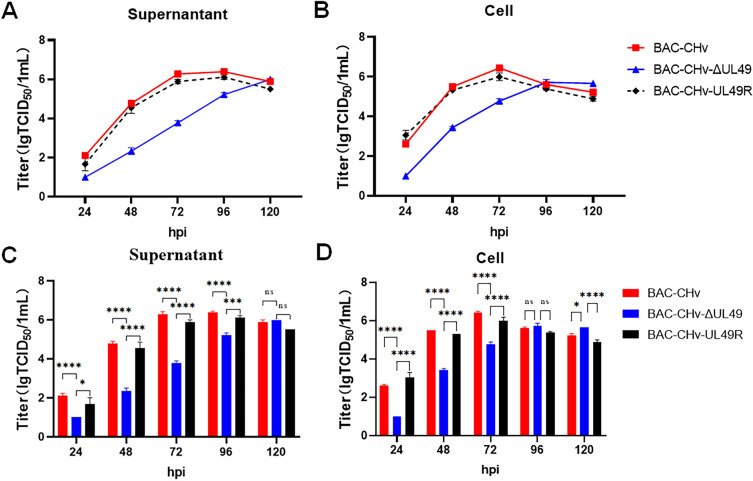
Figure 3.
Multi-step growth curves. DEF cells in a 24-well plate were infected with BAC-CHv, BAC-CHv-UL49R, and BAC-CHv-ΔUL49 at an MOI of 0.01. The supernatant and cell samples were collected at the specified time points, respectively, and viral titers were measured. Data were calculated as mean ± standard deviation (SD, P > 0.05). A Virus titer of supernatant. B Virus titer of cells. C Statistical analysis of virus titer difference in the supernatant at each time point. D Statistical analysis of differences in cell virus titers at each time point. The asterisk indicates a significant difference compared to the BAC-CHv and BAC-CHv-UL49R viruses (∗∗∗∗P < 0.0001; ∗∗∗P < 0.001; ∗P < 0.05).

