. 2023 Jun 20;52(14):4525–4548. doi: 10.1039/d2cs00464j

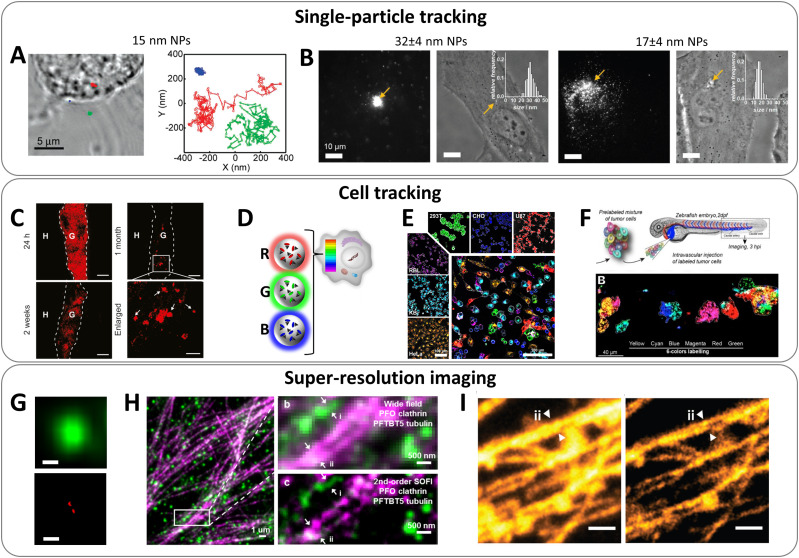
Fig. 10. Application of bright organic NPs for bioimaging. (A) Tracking 15 nm PFBT Pdots in macrophage-like J774 cells. Left: Transmission image of a fixed cell. The colour marks indicate the locations of NPs: particle bound to the membrane (blue), outside the cell (green), and in the cell interior (red). Right: The trajectories for the three particles. Reproduced with permission from ref. 145. Copyright American Chemical Society (B) epi-fluorescence and phase-contrast images of HeLa cell microinjected with 32 and 17 nm dye-loaded PMMA-based NPs. Injection points are indicated by arrows. Scale bars, 10 μm. Insets show distributions of particle sizes obtained by TEM. NPs were loaded with 10 wt% of R18/F5-TPB and coated with Tween 80. Reproduced with permission from ref. 25. Copyright John Wiley and Sons. (C) Tracking transplanted neurons in vivo. D16 hESC-derived neurons were labelled with 30 nm TPETPAFN AIE-NPs for 24 h prior to transplantation into mouse brain striatum. Brain tissues were collected 24 h, 2 weeks, and 1 month post-transplantation. Scale bar: 100 μm, enlarged panel scale bar: 50 μm. Reproduced with permission from ref. 149. Copyright Elsevier. (D) Principle of cell barcoding by 40 nm dye-loaded polymeric NPs of three different colours: blue, green and red loaded with DiO/F12-TPB, DiI/F12-TPB and DiD/F12-TPB, respectively. (E) Tracking multiple RGB barcoded cell populations. The large micrograph shows a confocal image six cell types (HeLa, KB, 293T, U87, RBL, and CHO) mixed and co-cultured for 24 h. Each cell type was labelled with an RGB barcode (orange, cyan, green, red, magenta, and blue, respectively), also shown separately in the smaller images. Images are superpositions of the three NP channels with identical settings and of the membrane channel in grey. Scale bar is 100 μm. (F) Tracking RGB barcoded cancer cells in zebrafish embryo: six batches of D2A1 cells were labelled with fluorescent NPs generating RGB barcodes (green, red, blue, yellow, magenta, and cyan) and imaged 3 h post-injection. (9 D–F) – Reproduced with permission from ref. 138. Copyright John Wiley and Sons. (G) Top: Standard TIRF image of immobilized 40 nm dye-loaded NPs (PLGA, 5 wt% R18/F5-TPB); bottom: the same field after applying a super-localization procedure, showing capacity to resolve two particles (scale bar, 200 nm). Reproduced with permission from ref. 33. Copyright Springer Nature. (H) Dual-color superresolution (SOFI) imaging of subcellular structures labelled with small (10 and 13 nm) photoblinking Pdots. Left: Wide field imaging of clathrin coated pits labeled with PFO (green) Pdots and microtubule labelled with PFTBT5 (red) Pdots. Top right: Magnified region show in white box in left panel. Bottom right: SOFI image generated by analysing 500 frames of raw data from the wide-field image. Reproduced with permission from ref. 144. Copyright American Chemical Society. (I) STED imaging of the microtubule structures labeled using the AIE NPs (14–16 nm): confocal (left) and super-resolution STED (right) images of the microtubules. Reproduced with permission from ref. 150. Copyright John Wiley and Sons.

Fig. 10