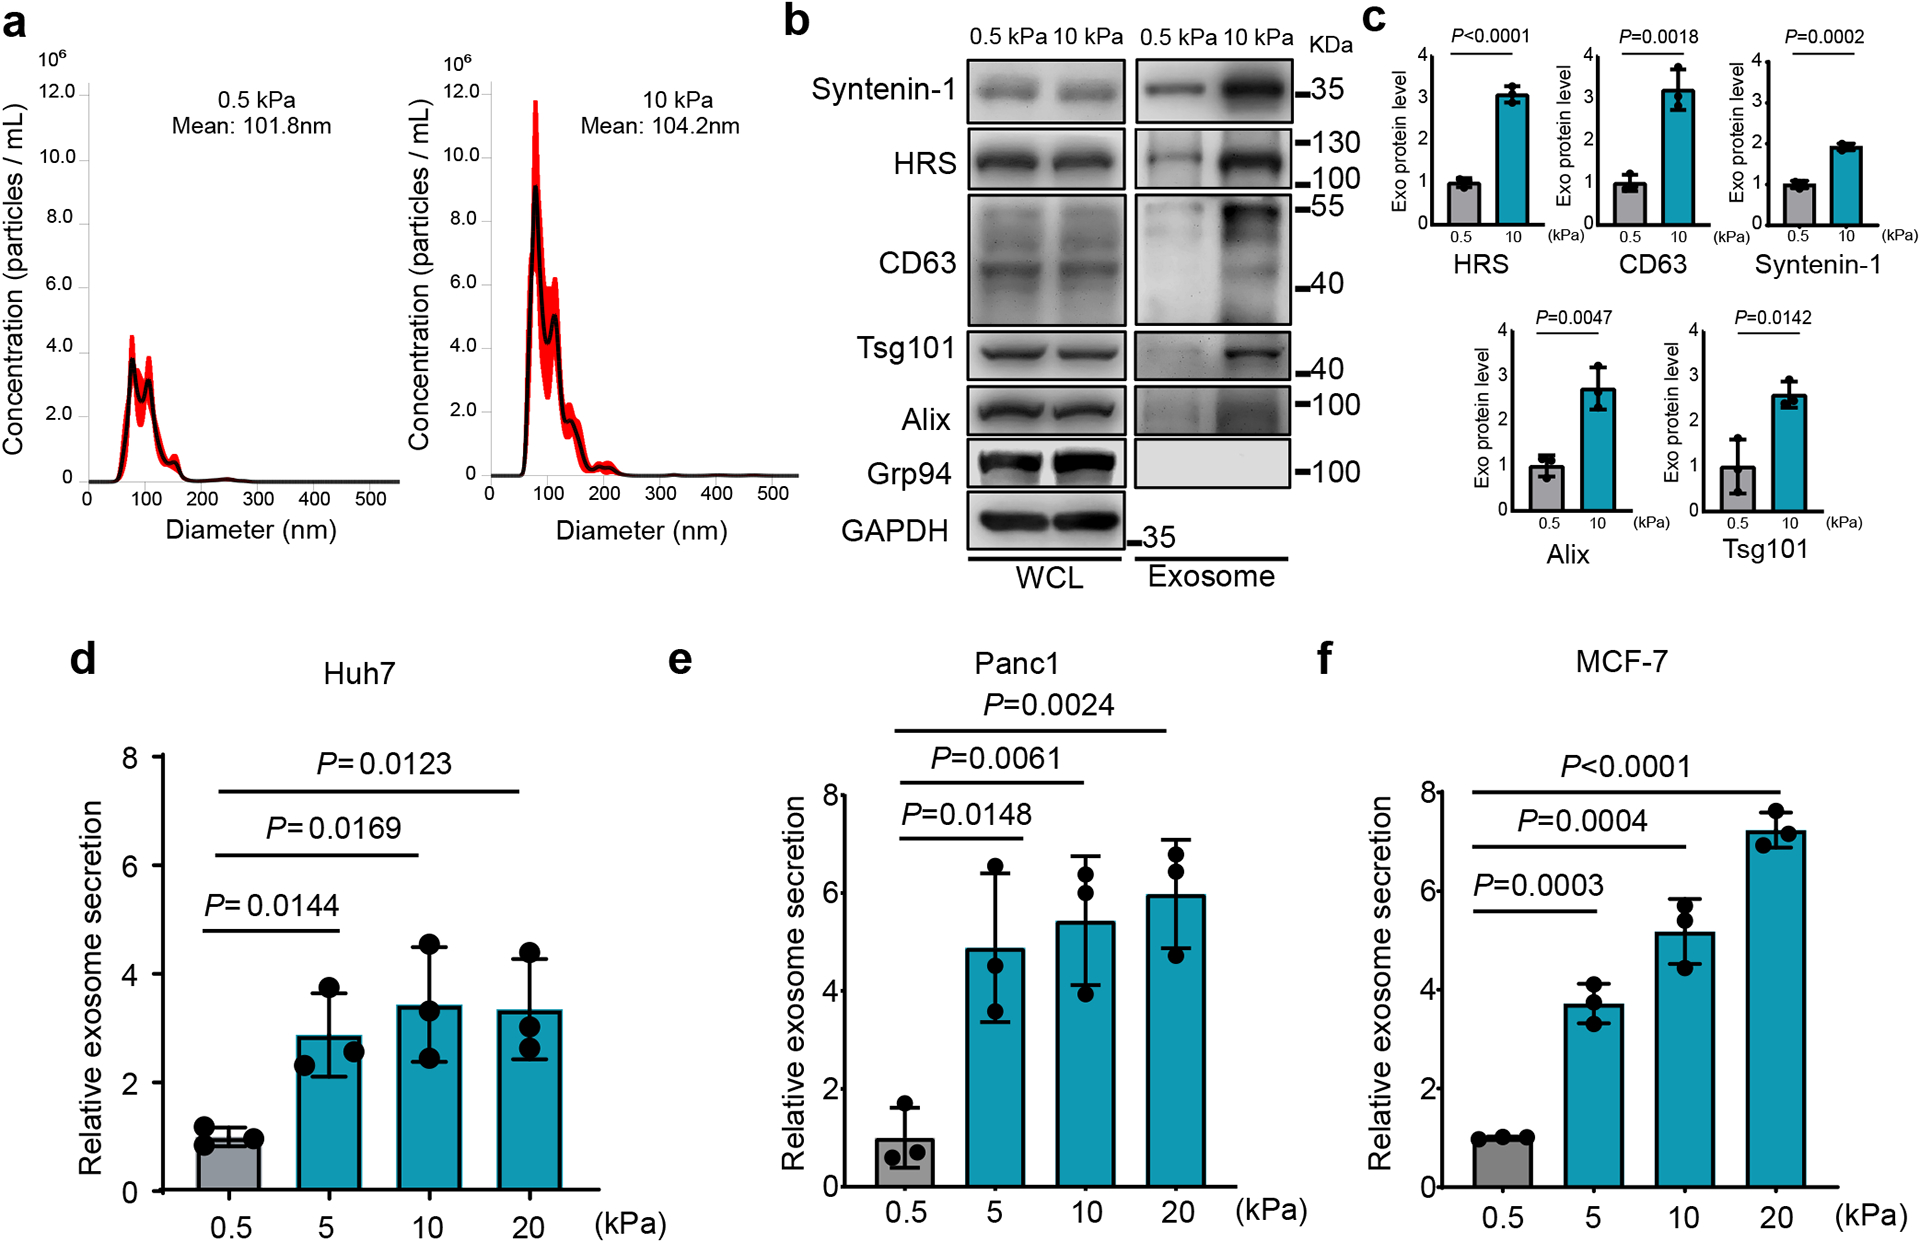
Fig. 1. Stiff ECM promotes exosome secretion.

a, The conditioned media from Huh7 cells growing on soft (0.5 kPa) or stiff (10 kPa) matrix were collected. After depletion of cell debris and large vesicles by centrifugation, the supernatant containing exosomes was proceeded for NTA. A representative NTA analysis is shown. The X-axis represents the diameters of the vesicles and the Y-axis represents the concentration (particles/ml) the vesicles (n=3 independent captures). Values are presented as Mean ± S.E.M. b, Immunoblotting of exosome markers (HRS, Syntenin-1, Alix, Tsg101, and CD63) in the whole cell lysate (“WCL”) and purified exosomes from 107 Huh7 cells on soft and stiff matrix. Grp94 (ER marker) was used as a negative control. GAPDH was used as a cell lysate loading control. Molecular weights (in kDa) are shown to the right. c, Quantification of the levels of HRS, Syntenin-1, CD63, Alix, and Tsg101. Proteins on exosomes released from cells grown on 0.5 kPa matrix was normalized as 1. Values are presented as Mean ± S.D. n=3 independent experiments. d-f, Exosomes released from the same number of cells (Huh7, Panc1, and MCF7) grown on matrix with different stiffness were quantified and the amounts of exosomes released from cells grown on 0.5 kPa matrix were normalized as 1. Values are presented as Mean ± S.D. n=3 independent experiments. See METHODS for statistical analyses of all the figures. Source numerical data and unprocessed blots are available in source data.
