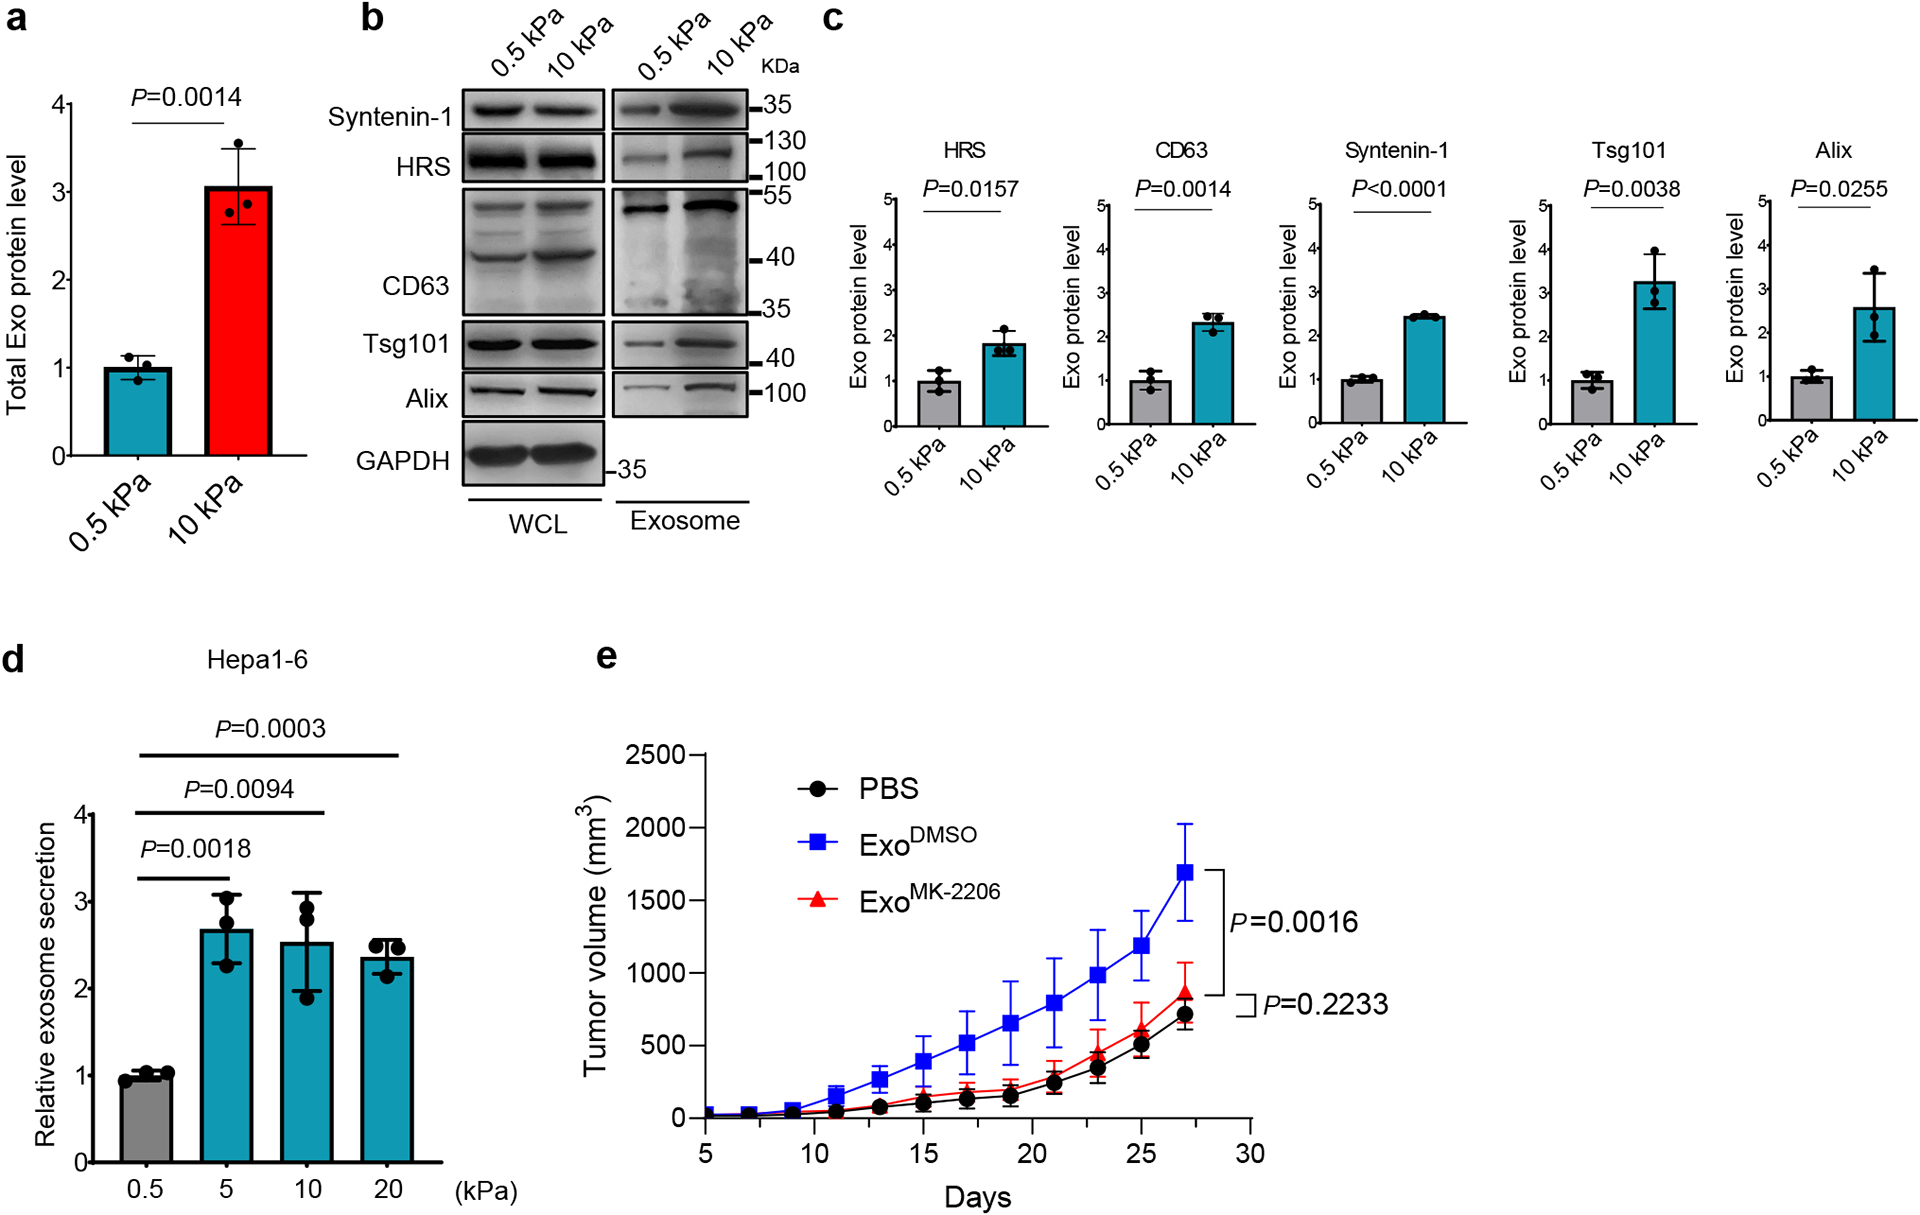
Extended Data Fig. 4. Hepa1-6 cells secreted more exosomes when grown on stiff Matrix.

a, Hepa1-6 cells were cultured on soft (0.5 kPa) or stiff (10 kPa) matrix. Exosomes in the conditioned media were purified. Quantification of the exosomal proteins by Bradford assay. The amounts of exosomal proteins were normalized to those from soft matrix. Values are presented as Mean ± S.D. n=3. b, Exosomes from the same number of cells were analyzed by immunoblotting using antibodies against indicated exosome markers. c, Quantification of the levels of HRS, Syntenin-1, CD63, Alix and Tsg101 is presented. Mean ± S.D. n=3. d, Exosomes released from the same number of Hepa1-6 cells grown on matrix with different stiffness were quantified, and the concentration of exosomes released from cells grown on 0.5 kPa matrix were normalized as 1. Values are presented as Mean ± S.D. n=3. n represents the number of independent experiments. e, Growth curves of Hepa 1-6 tumors in C57L/J mice injected with PBS or the same amounts of exosomes derived from Hepa1-6 cells treated with DMSO or MK-2206 (n=5 mice). Values are presented as Mean ± S.D. Source numerical data and unprocessed blots are available in source data.
