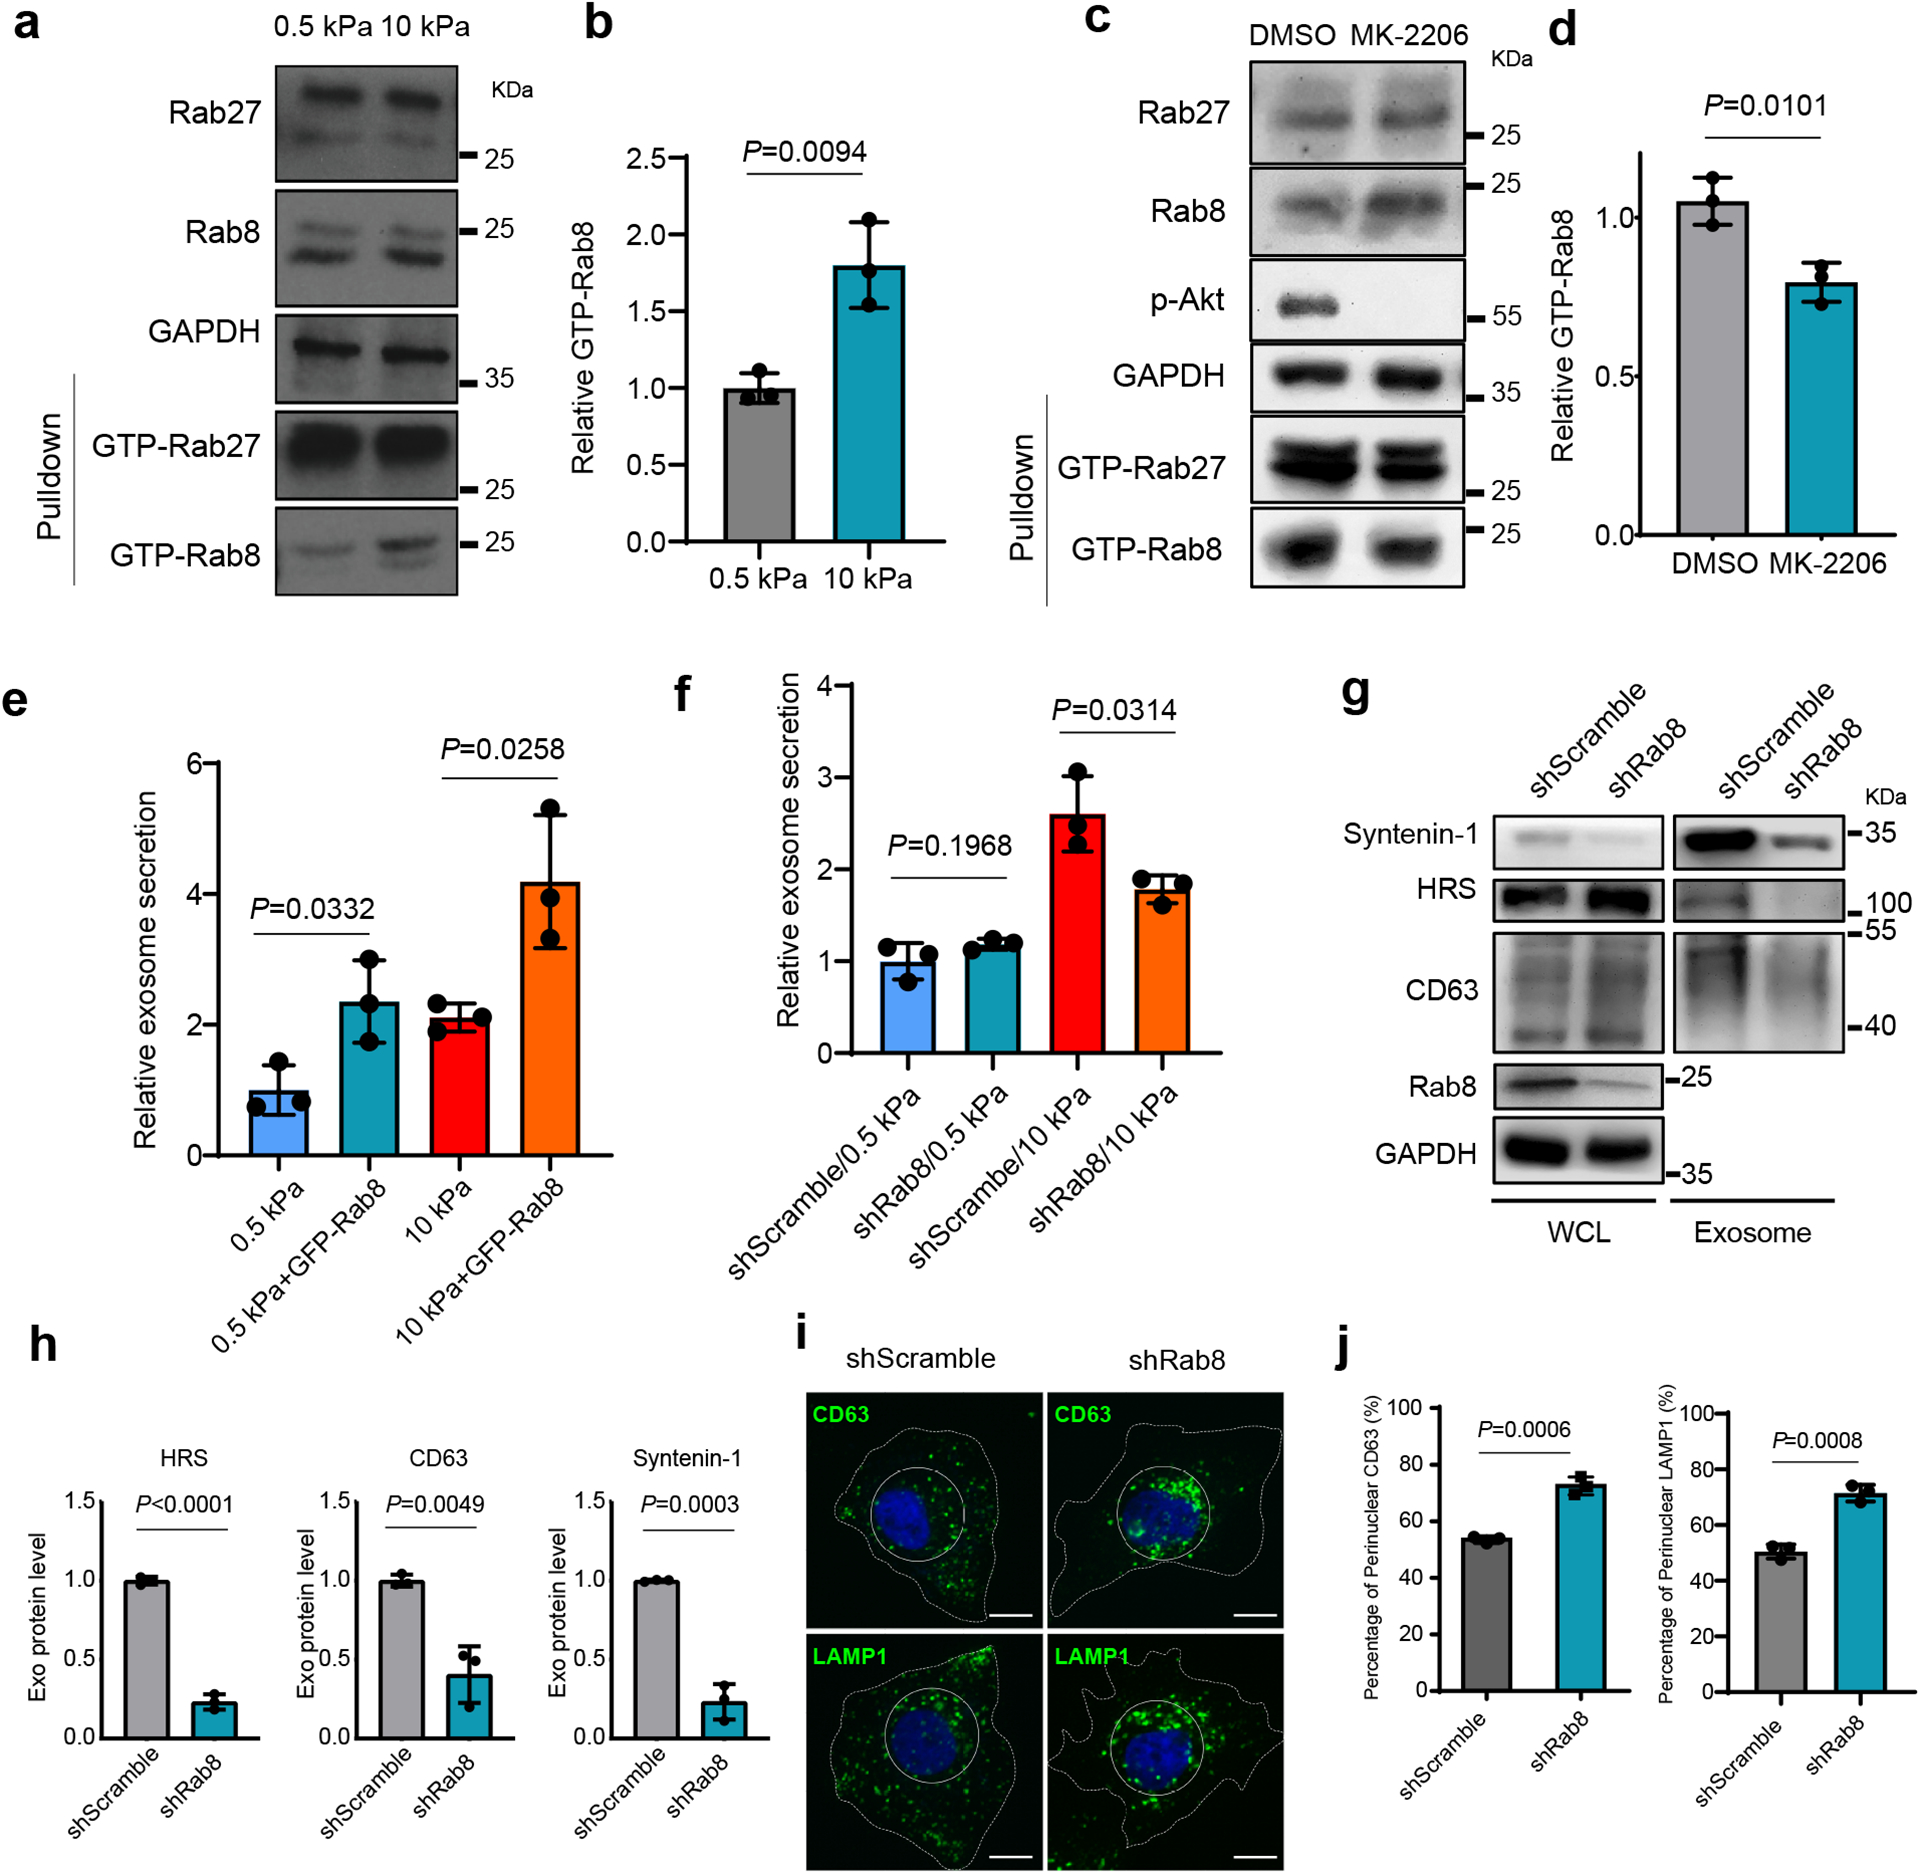
Fig. 3. Rab8 regulates stiff ECM-mediated exosome secretion.

a, The same amounts of lysates from cells grown on 0.5 kPa or 10 kPa matrix were incubated with GST-JFC1 RBD fusion protein. Rab8 and Rab27 in cell lysates or the activated form of Rab8 and Rab27 bound to GST-JFC1 RBD (“GTP-Rab8” and “GTP-Rab27” pulled down) were analyzed by immunoblotting. b, GTP-Rab8 quantified by ImageJ and normalized to levels for cells on soft matrix. Values are presented as Mean ± S.D., n=3. c, Cells grown on stiff matrix were treated with DMSO or MK-2206, and lysed for GST-JFC1 RBD pulldown. Proteins were analyzed by western blotting. d, GTP-Rab8 and GTP-Rab27 were quantified by Image J and normalized to levels of cells treated with DMSO. Values are presented as Mean ± S.D., n=3. e, Huh7 cells expressing GFP or GFP-Rab8 were grown on soft or stiff matrix. The conditioned media were collected for NTA. Exosome concentrations were normalized to those from cells expressing GFP on soft matrix. Values are presented as Mean ± S.D., n=3. f, Conditioned media from Huh7 cells transfected with control shRNA (“shScramble”) or Rab8 shRNA on soft or stiff matrix were collected for NTA. The concentrations of exosomes were normalized to those from cells on soft matrix with control shRNA. Values are presented as Mean ± S.D., n=3. g, Exosomes in the conditioned media of Huh7 cells grown on stiff matrix with or without Rab8 knockdown were purified by ultracentrifugation, and the exosomes from the same number of cells were loaded for immunoblotting for HRS, Syntenin-1, and CD63. h, Quantification of the levels of HRS, Syntenin-1, and CD63. Values are presented as Mean ± S.D. n=3. i, Huh7 cells were treated with control or Rab8 shRNA, and then immunostained for CD63 and LAMP1. Nuclei were stained with DAPI. Rab8 knockdown led to the clustering of CD63 and LAMP1 to the perinuclear region (solid circle). Scale Bar: 10 μm. j, Quantification of the percentage of perinuclear CD63 and LAMP1 signals. Values are presented as Mean ± S.D. n=3. Source numerical data and unprocessed blots are available in source data. n represents the number of independent experiments.
