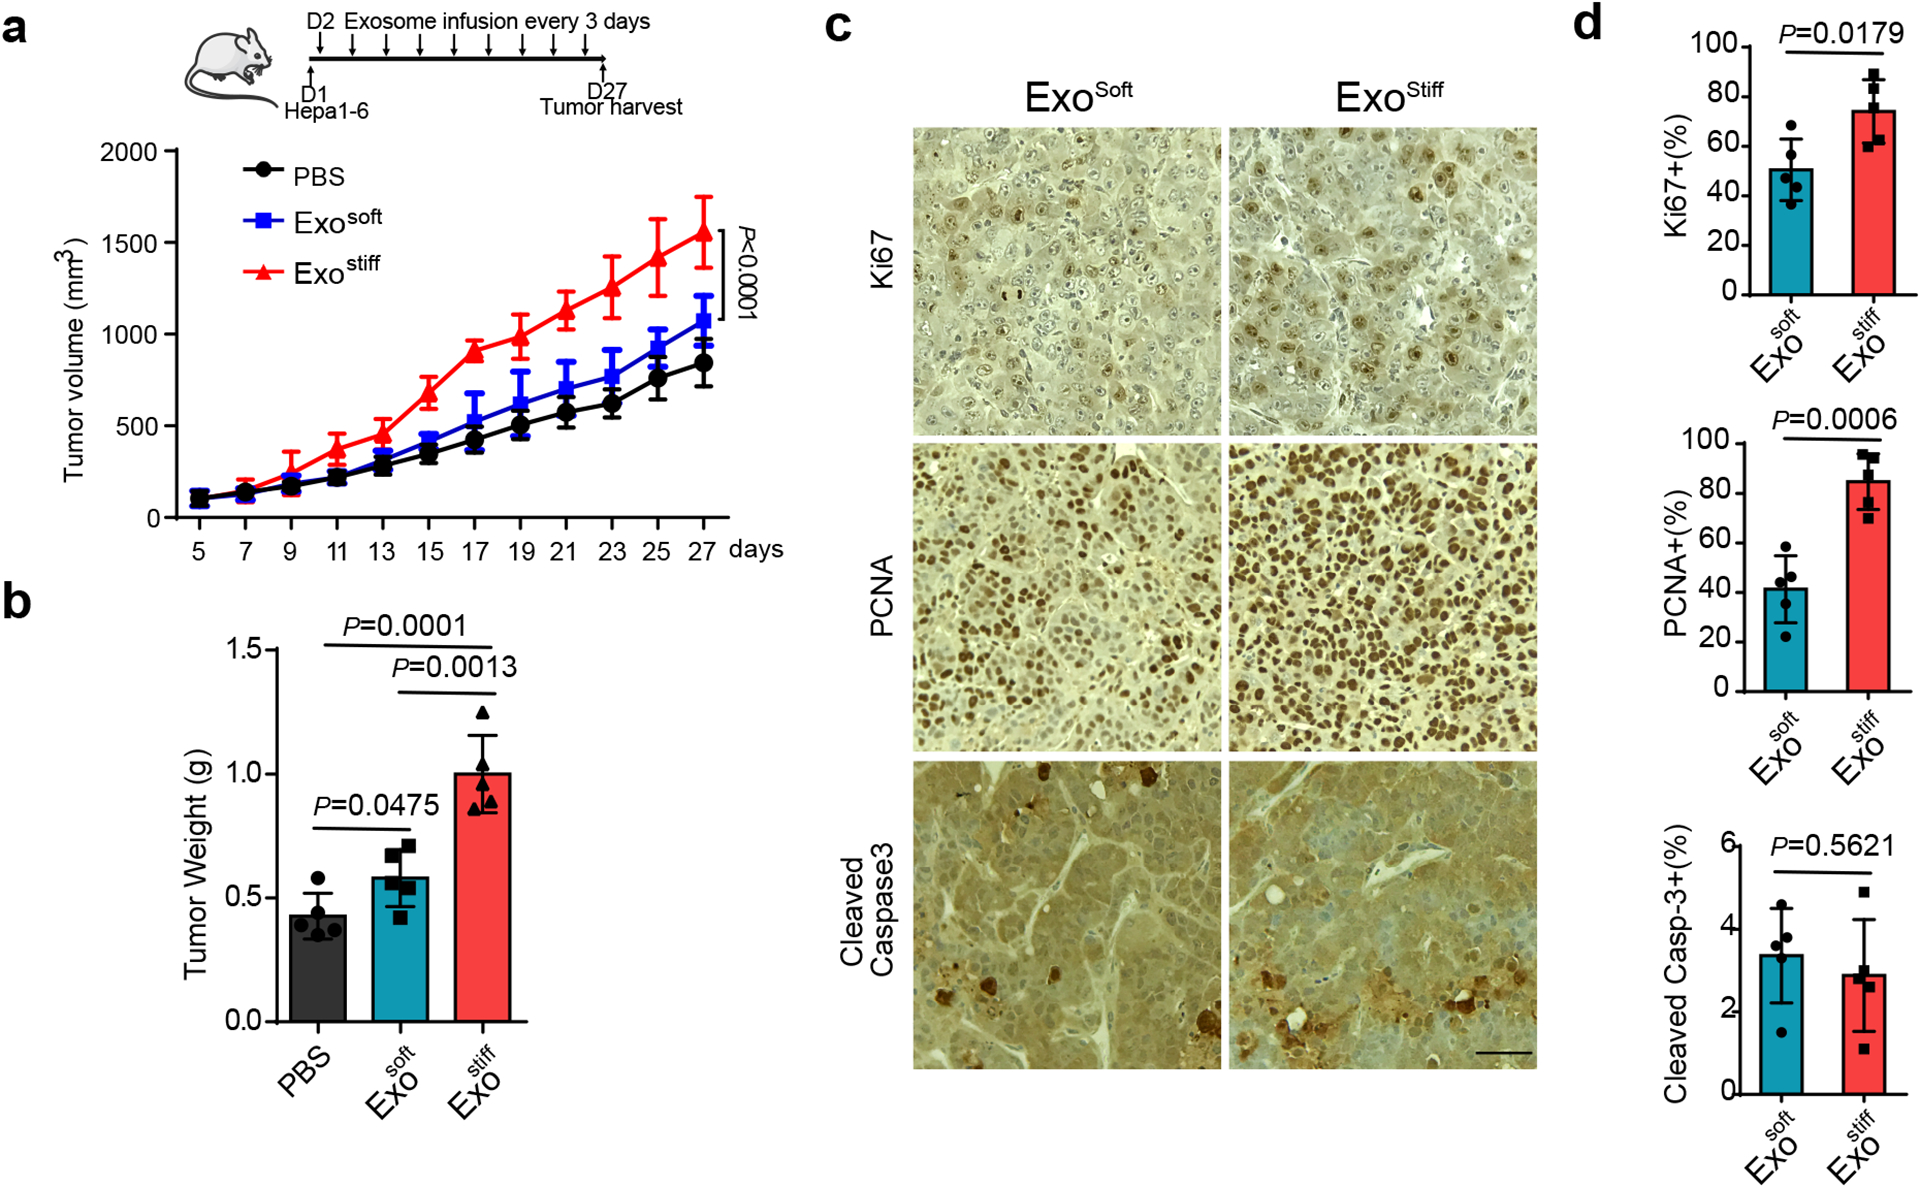
Fig. 5. Exosomes induced by stiff matrix promote tumor growth.

a, Growth curves of Hepa1-6 tumors in C57L/J mice injected with PBS and indicated exosomes (n=5). Values are presented as Mean ± S.D. A diagram indicating the time points of exosome infusion is shown at the top. b, The weights of Hepa1-6 tumors in C57L/J mice after treatment with PBS, Exosoft or Exostiff (n=5). Values are presented as Mean ± S.D. c, Immunohistochemistry of Ki67, PCNA and cleaved Caspase3 on xenograft of mice treated with Exosoft or Exostiff. d, Quantification of cells stained positive with these marker proteins were shown to the right. Scale Bar: 100μm. For all figures above, values are presented as Mean ± S.D., n=5. Source numerical data are available in source data. n represents the number of animals.
