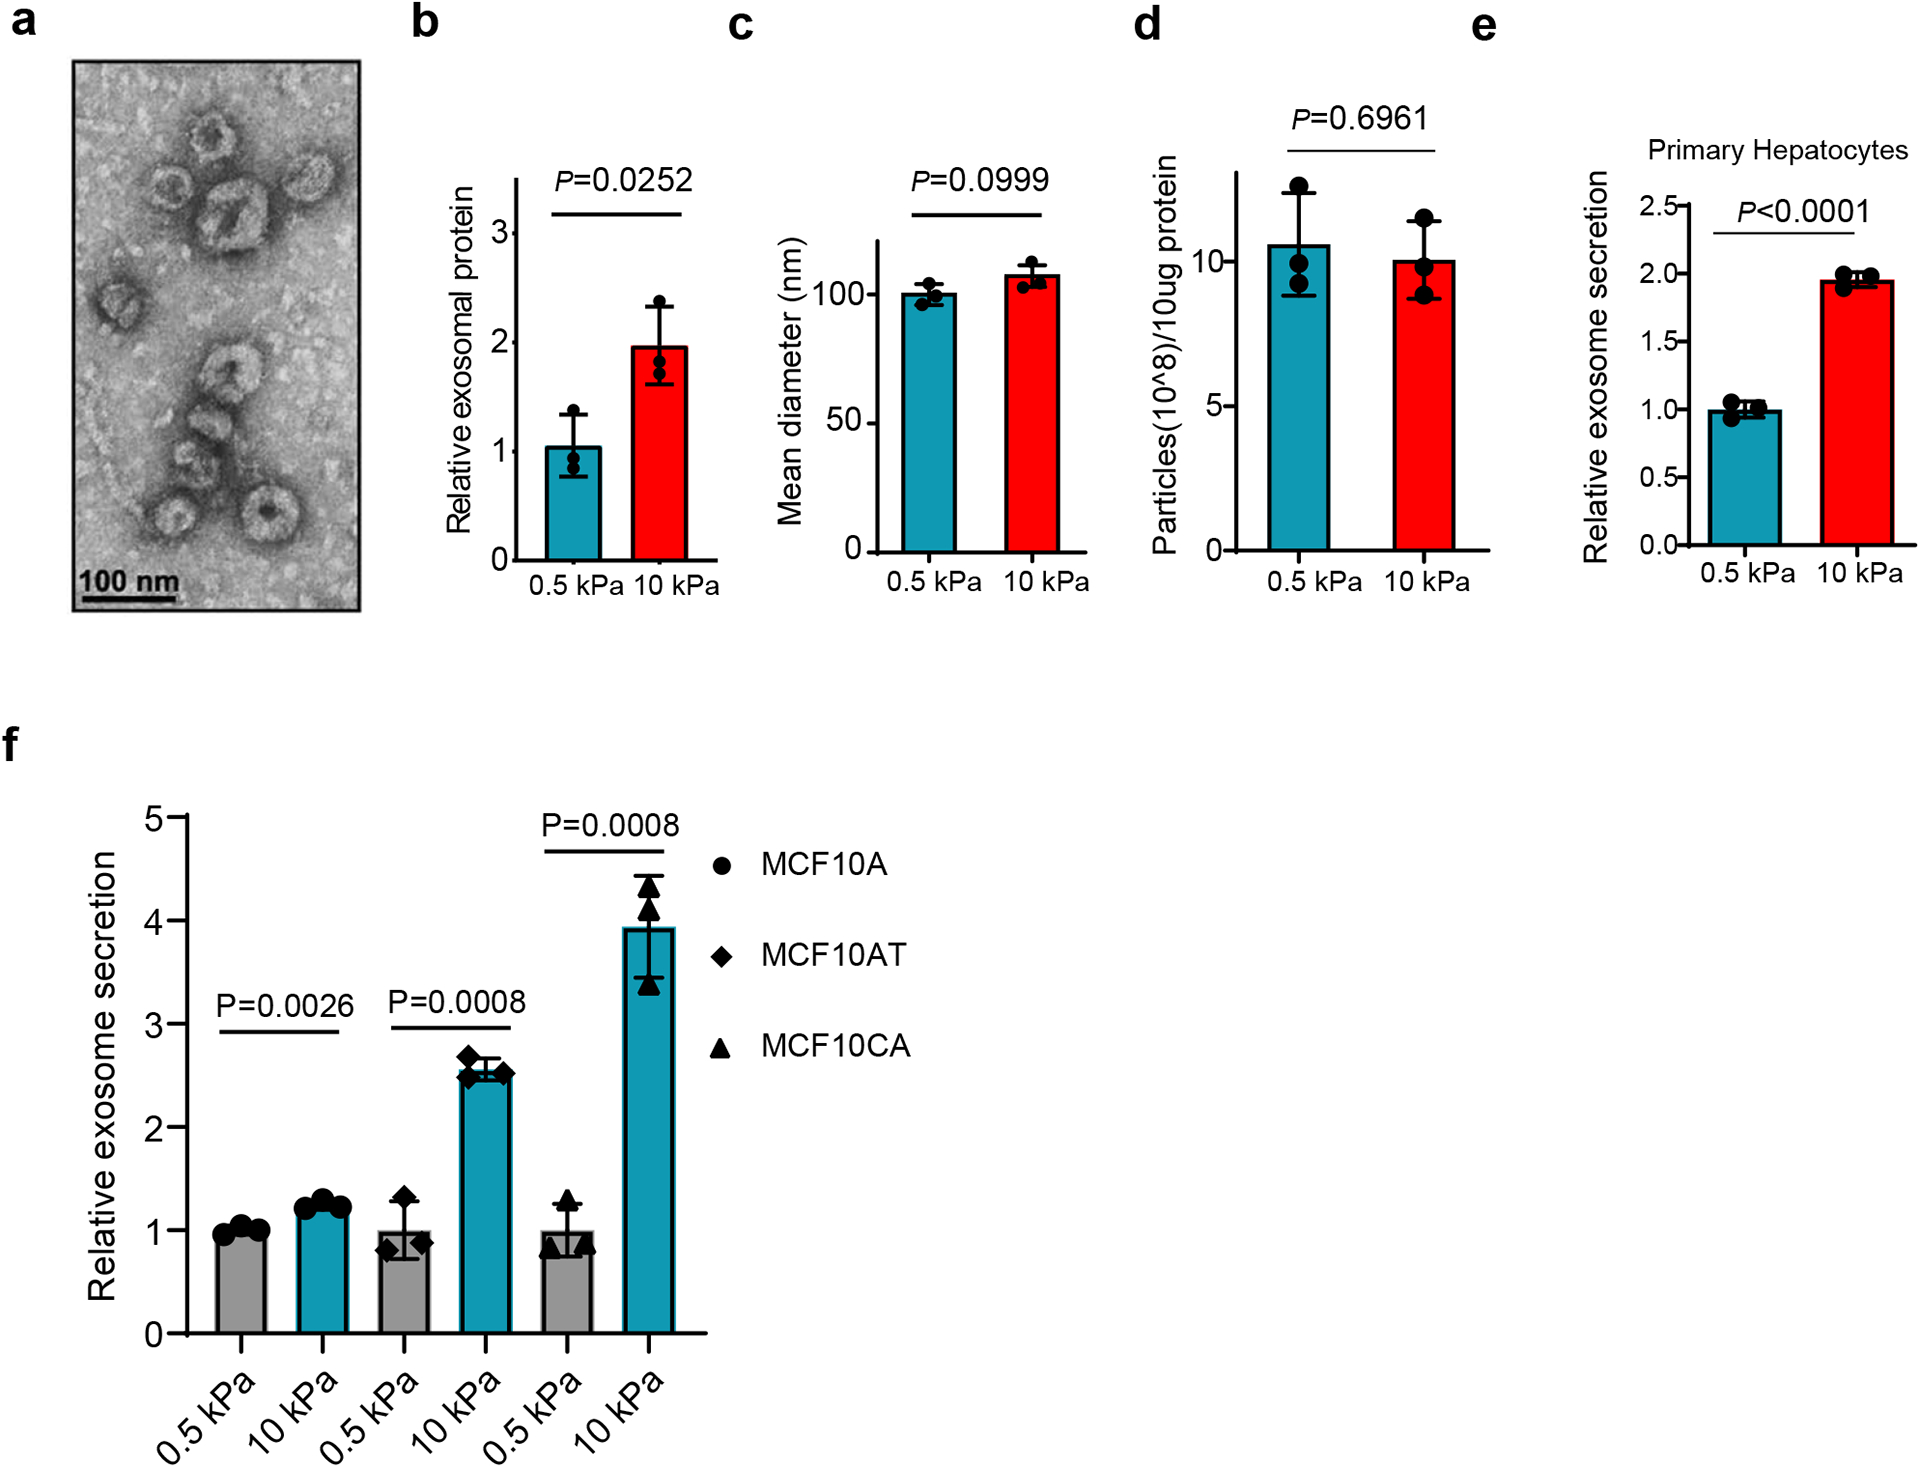
Extended Data Fig. 1. Characterization of exosomes derived from different cells.

a, Representative TEM image of exosomes purified from the conditioned media of Huh7 cells. Scale bar: 100 nm. b, Purified exosome proteins were quantitated by Bradford assay and the mean was normalized to 1 for exosomal proteins from soft (0.5 kPa) matrix. Exosomes were collected from equal numbers of cells. Values are presented as Mean ± S.D. n=3. c, The mean diameters of exosomes purified from the conditioned media of Huh7 cells on soft or stiff matrix. Values are presented as mean ± S.D. 3 independent experiments were performed. At least 106 of purified exosomes were measured by NTA for each experiment. d, Exosomes (10 μg) derived from Huh7 cells on soft or stiff matrix were diluted with 1 ml PBS. The particle concentration was determined by NTA. Values are presented as Mean ± S.D. n=3. e, Exosomes released from the same number of primary hepatocytes grown on matrix with different stiffness were quantified, and the concentration of exosomes released from cells were normalized to the 0.5 kPa group. Values are presented as Mean ± S.D. n=3. F, Exosomes released from the same number of MCF10A, MCF10AT, and MCF10CA cells grown on matrix with different stiffness were quantified. The amounts of exosomes released from the cells were normalized to the 0.5 kPa for each cell line. Mean ± S.D. n=3. Source numerical data and unprocessed blots are available in source data. n represents the number of independent experiments.
