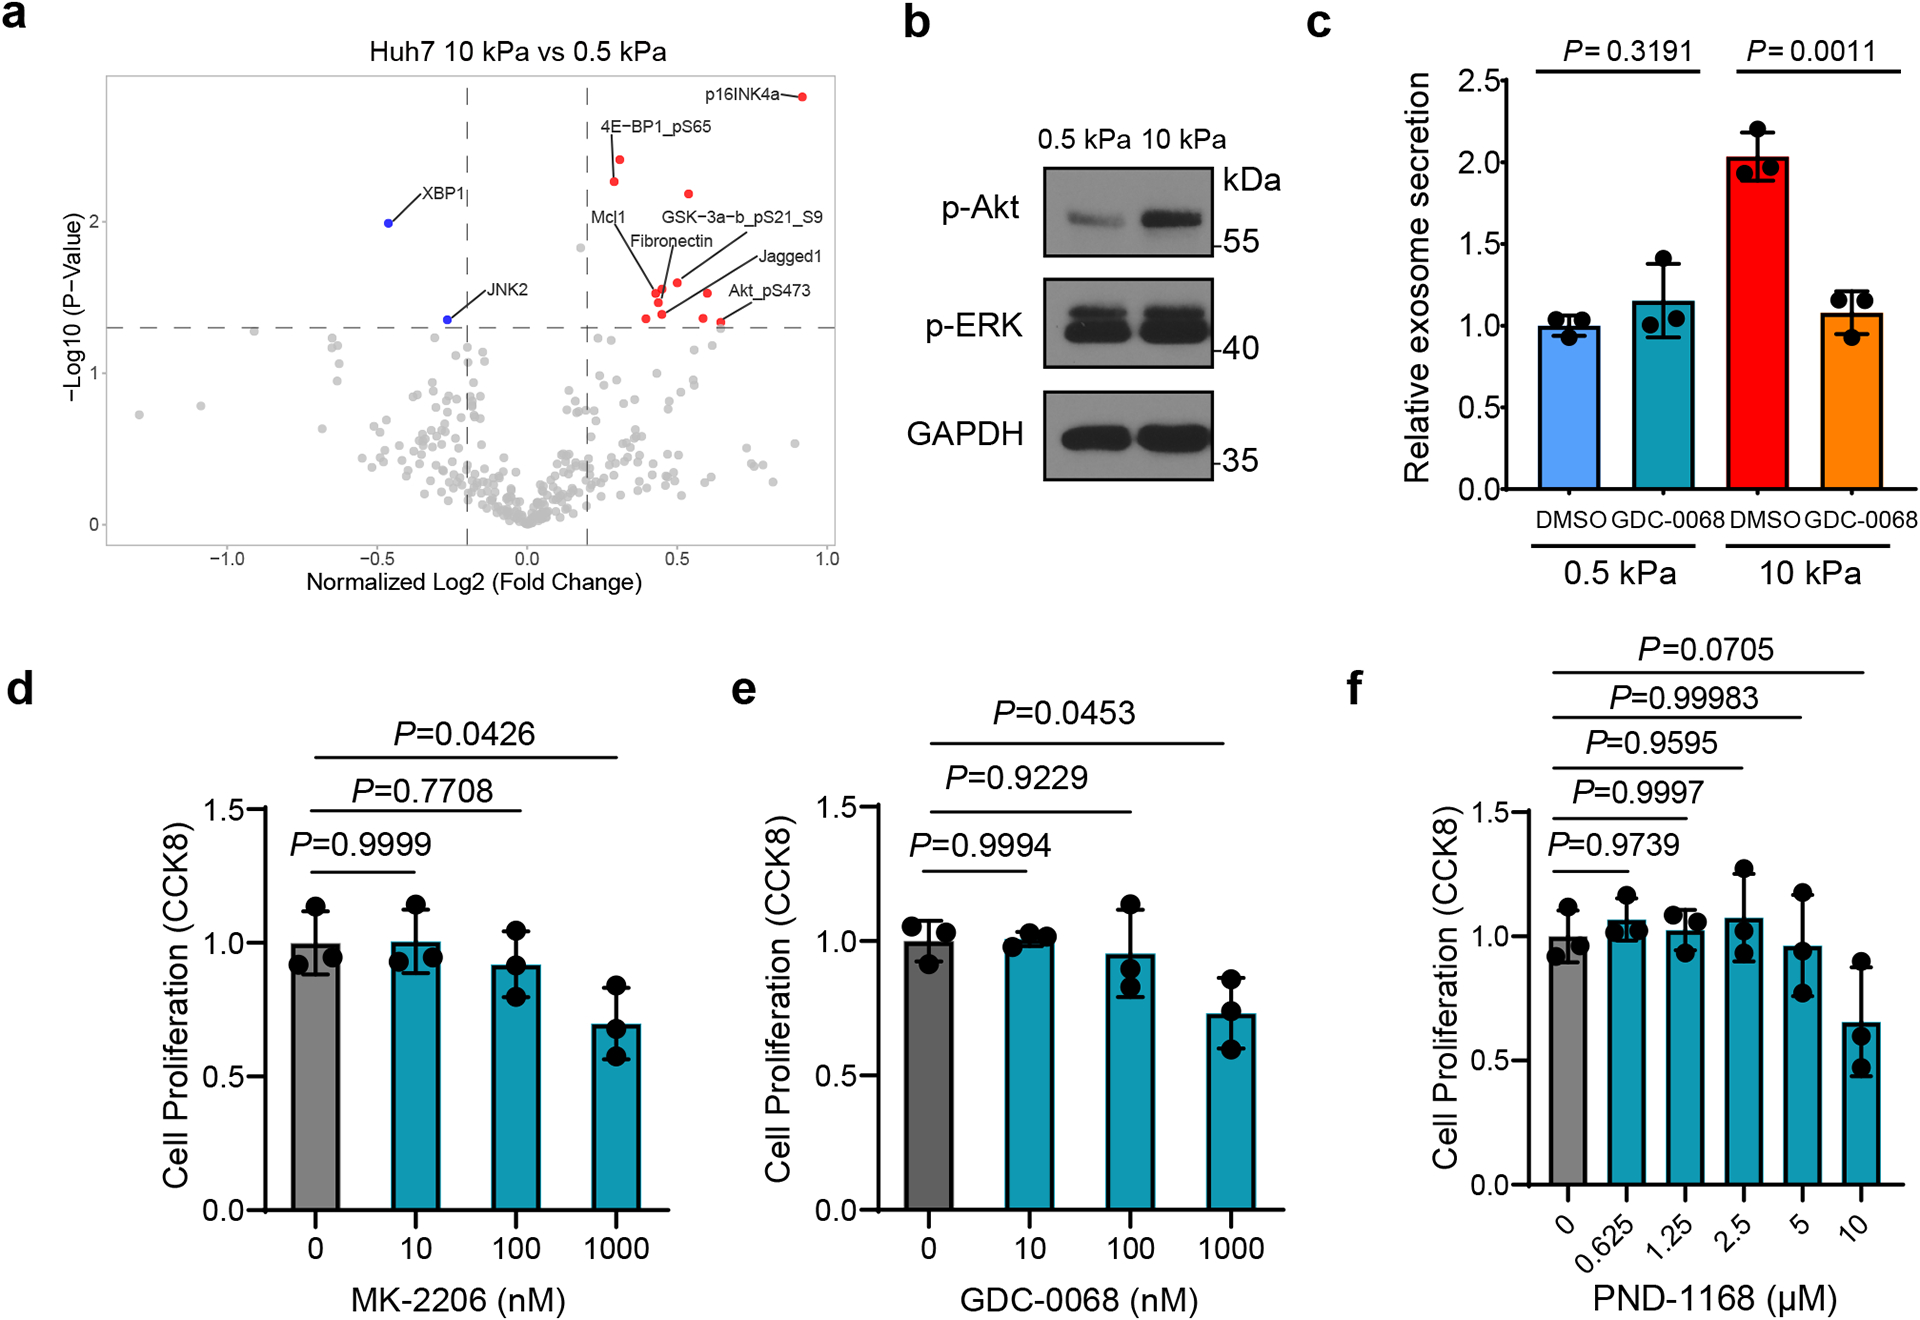
Extended Data Fig. 2. Exosome secretion from Huh7 cells treated with Akt and FAK inhibitors.

a, Volcano plot of RPPA data displaying the pattern of protein expression for Huh7 cells cultured on stiff (10 kPa) matrix relative to soft (0.5 kPa) matrix. Significantly up- and down-regulated proteins are indicated by red and blue dots, respectively (cut-off p<0.05). All the data points were normalized for protein loading and transformed to Log2 values (labeled “NormLog2” on X-axis). b, Western blots showing the up-regulation of p-Akt but not p-ERK in Huh7 cells grown on stiff ECM. Molecular weights (in kDa) are shown to the right. c, Huh7 cells on soft or stiff matrix were treated with DMSO or Akt inhibitor GDC-0068. The conditioned media were collected and proceeded for NTA. Exosome concentration from the cells treated with DMSO on soft matrix was normalized to 1. Values are presented as Mean ± S.D., n=3. d-f, Huh7 cells were treated with DMSO or various concentrations of Akt inhibitors MK-2206, GDC-0068 or FAK inhibitor PND-1168. Cell viability was examined by CCK-8 assay and normalized to the value of DMSO treated group. Values are presented as Mean ± S.D. n=3. Source numerical data and unprocessed blots are available in source data. n represents the number of independent experiments.
