
Figure 2. CD103int DCs express markers of maturation.
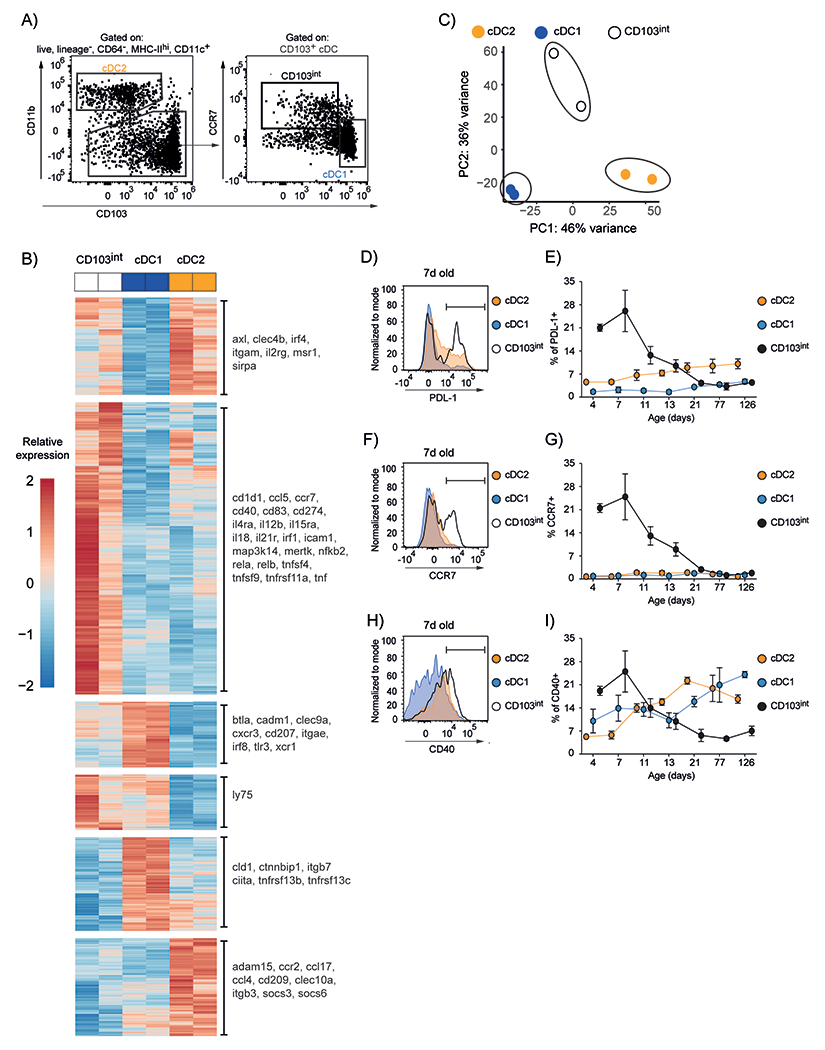
A. Gating strategy for sorting DC subsets from the lungs of 7–day old mice. The plot on the left was gated on live, singlet lymphocyte, Lin−CD64−MHCII+CD11c+ cells, according to the gating strategy in fig. S1. B. mRNA was obtained from DCs sorted from the lungs of eight 7–day old C57BL/6 mice in 2 independent experiments. Principal component analysis of gene expression among DC subsets. C. Heatmap visualization of differentially expressed genes (DEG) among DC subsets. Scale is row z-score. D. Representative histogram of PD–L1 expression on DC subsets at day 7. The gate representing PD–L1+ cells is indicated. E. Frequency of PD-L1-expressing cells within the total population of each subset. F. Representative histogram of CCR7 expression on DC subsets at day 7. The gate representing CCR7+ cells is indicated G. Frequency of CCR7-expressing cells within the total population of each subset. H. Representative histogram of CD40 expression on DC subsets at day 7. The gate representing CD40+ cells is indicated I. Frequency of CD40-expressing cells within the total population of each subset. Graphs are plotted as mean ± SD. This experiment was performed 5 times with 5 mice/timepoint on days 4, 7, 11 and 4 mice/timepoint on days 13, 21, 77 and 126.