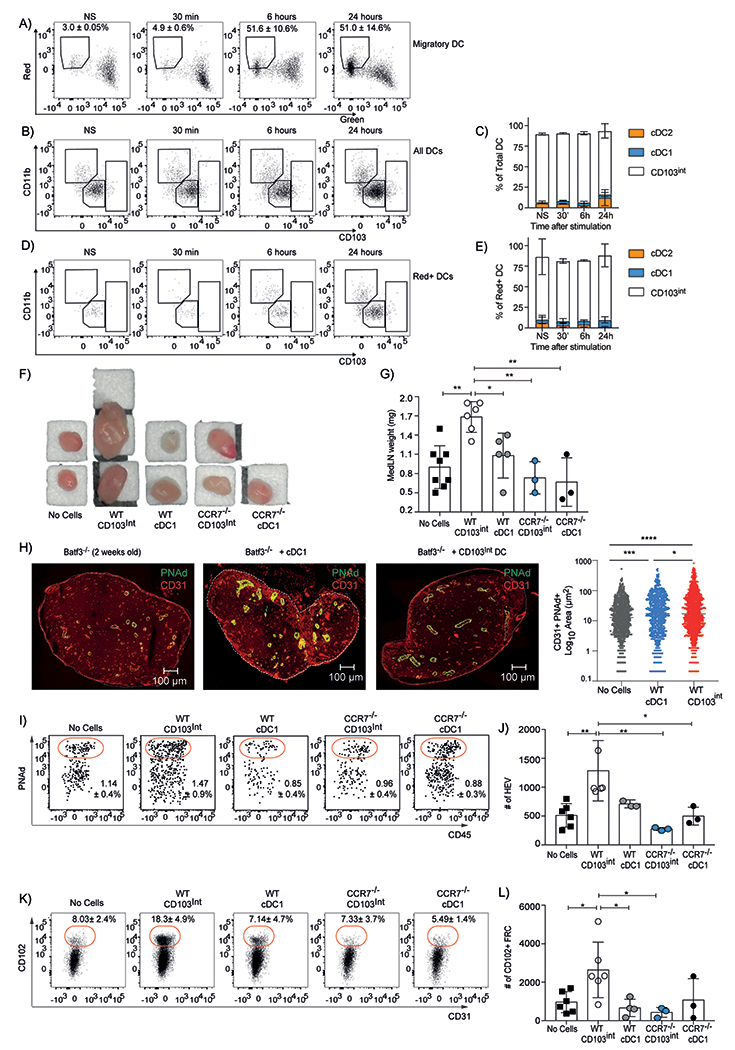
Figure 4. Migratory CD103int DCs promote LN expansion and stromal cell maturation.

A. Representative plots show the frequency (mean ± SD) of photo–converted migratory DCs (gated on Lin−CD64−CD11c+MHCII+ cells) in the mLNs. B. Representative plots of total DCs in the mLN after photoconversion. C. The relative proportions (mean ± SD) of DC subsets in mLN after photoconversion. D. Representative plots of photoconverted (red) DCs in the mLN. E. The relative proportions (mean ± SD) of photoconverted DC subsets in mLN. This experiment was performed twice with 3 mice/timepoint. F-G. CD103int and cDC1 cells were sorted from the lungs of 7–day old C57BL/6 and Ccr7−/− mice, intranasally administered to 14–day old Batf3−/− mice and the size (F) and mass (G) of the mLNs of recipient mice were determined 2 days later. Data in G are combined from 2 independent experiments. Significance was tested using ordinary one-way ANOVA and Tukey test. *p<0.05, **p<0.01. H. Representative images of PNAd and CD31 expression in mLNs of recipient Batf3−/− mice 2 days after intranasal DC transfer. The area of PNAd+CD31+ HEVs was quantified using 3 sections/mLN from 2 independent experiments with 3 mice per group. Significance was tested using ordinary one-way ANOVA and Tukey test. *p<0.05, ***p<0.01, ****p<0.0001. I. Representative plots of HEV cells (gated on CD31+PDPN− cells) in mLNs of recipient Batf3−/− mice 2 days after DC transfer. J. The numbers (mean ± SD) of CD45−CD31+PNAd+ HEV cells per mLN. K. Representative plots of FRC cells (gated on CD45−PDPN+CD31− cells) in mLNs of recipient Batf3−/− mice 2 days after DC transfer. L. The numbers (mean ± SD) of CD45−CD31−PDPN+CD102+ FRC cells per mLN. Data are representative of 2 experiments with at least 3 mice/group. Significance was determined using 2–way ANOVA. Bar and whiskers represent the mean ± SD. *p<0.05, **p<0.01.
