
Figure 5. Microbiota and TLR signaling are dispensable for CD103int DCs.
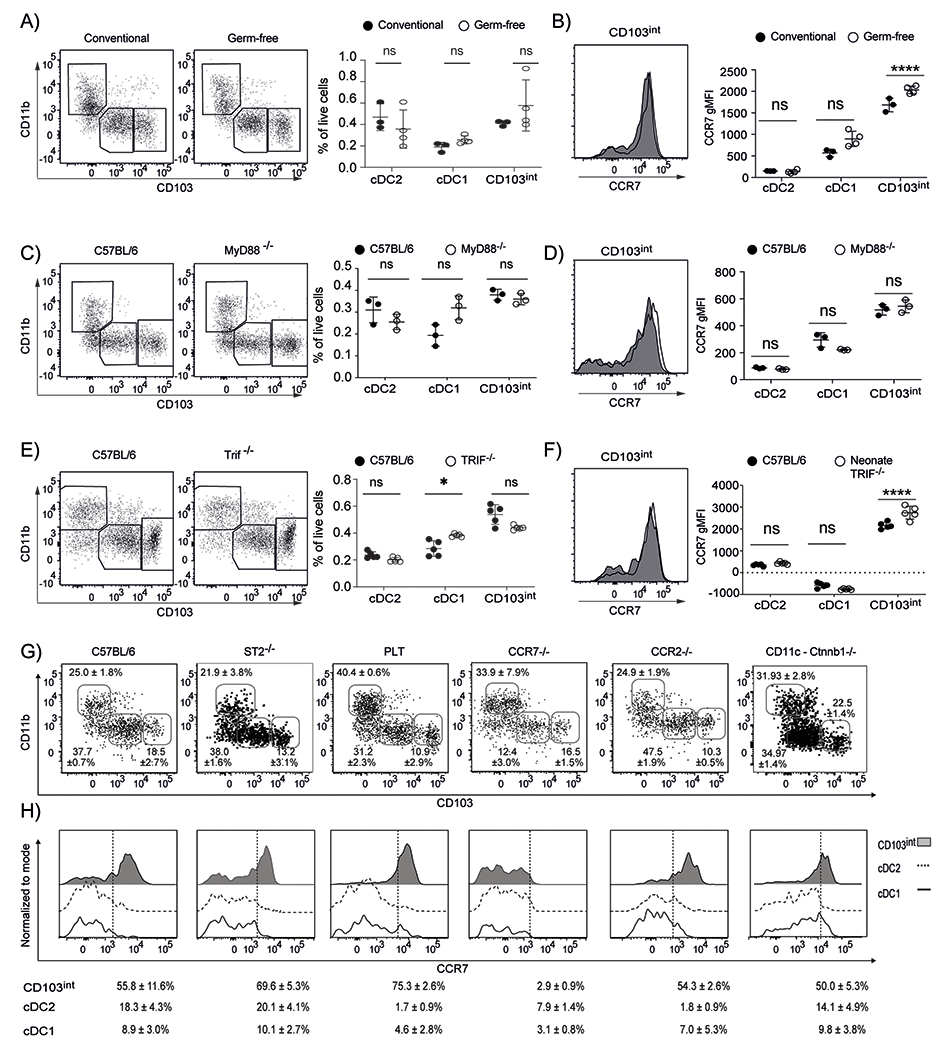
A. Representative plots (gated on Lin−CD64−CD11c+MHCII+ cells) and frequencies (mean ± SD) of DC subsets in total live cells in the lungs of 7–day old C57BL/6 mice housed in conventional or GF conditions. B. Representative histograms of CCR7 expression on CD103int DCs and graphs of gMFI of CCR7 on DC subsets from the lungs of 7–day old C57BL/6 mice housed in conventional or GF conditions. C. Representative plots (gated on Lin−CD64−CD11c+MHCII+ cells) and frequencies (mean ± SD) of DC subsets in total live cells in the lungs of 7–day old C57BL/6 and Myd88−/− mice. D. Representative histograms of CCR7 expression on CD103int DCs and graphs of gMFI of CCR7 on DC subsets from the lungs of 7–day old C57BL/6 and Myd88−/− mice. E. Representative plots (gated on Lin−CD64−CD11c+MHCII+ cells) and frequencies (mean ± SD) of DC subsets in total live cells in the lungs of 7–day old C57BL/6 and Trif−/− mice. F. Representative histograms of CCR7 expression on CD103int DCs and graphs of gMFI of CCR7 on DC subsets from the lungs of 7–day old C57BL/6 and Trif−/− mice. These experiments were performed 2 times for each comparison with 3 mice (A–B), 3 mice (C–D) and 5 mice (E–F) per group. Significance was determined using 2-way ANOVA with Sidak multiple comparision test. *p<0.05, ***p<0.001, ****p<0.0001. G. Representative plots (gated on Lin−CD64−CD11c+MHCII+ cells) and frequencies (mean ± SD) of DC subsets in the lungs of 7–day old C57BL/6, ST2−/−, plt/plt, Ccr7−/−, Ccr2−/− mice and CD11c-Ctnnb1−/− mice. H. Representative histograms of CCR7 expression and frequency (mean ± SD) of CCR7+ cells in DC subsets. Dashed lines divide marker+ from marker− cells. These experiments were performed at least 2 times with 3 C57BL/7, 4 ST2−/−, 3 plt/plt, 3 Ccr7−/−, 3 Ccr2−/− mice and 6 CD11c-Ctnnb1−/− mice.