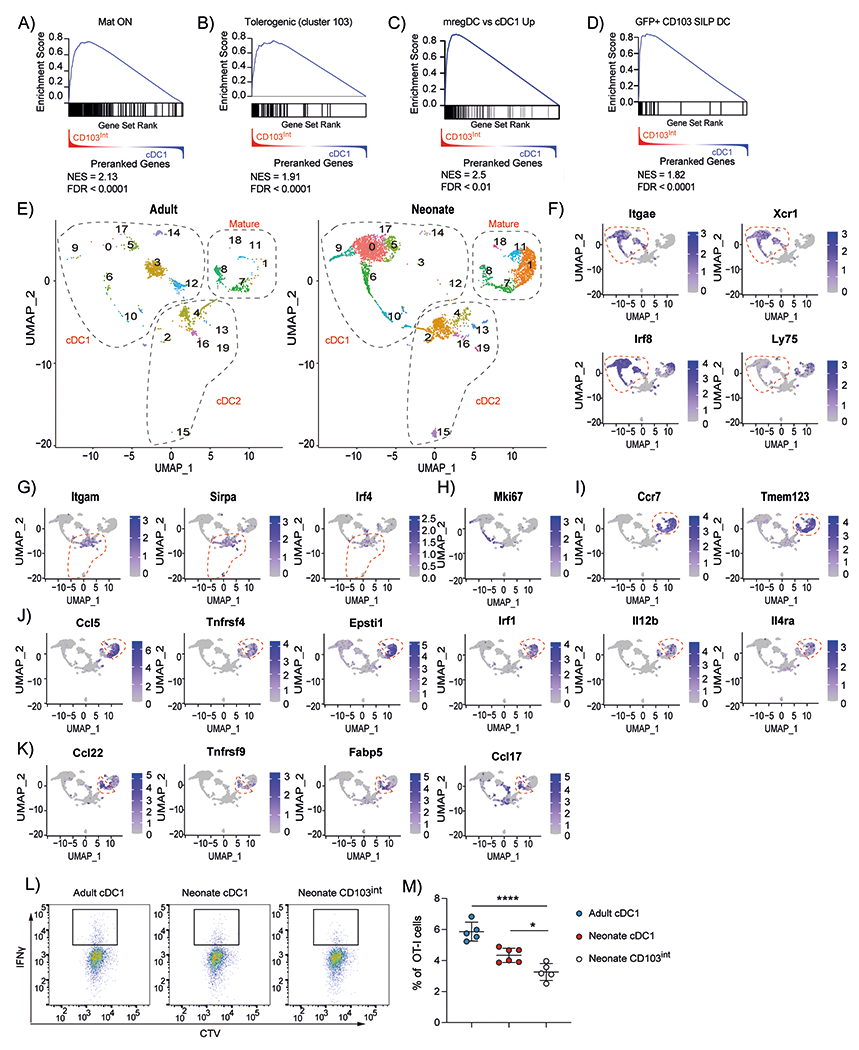
Figure 6. CD103int DCs have a regulatory signature.

A ranked list of genes differentially expressed in CD103int over cDC1 cells was compared with genes enriched in mature DCs from the thymus (A), genes enriched in tolerogenic DCs from the thymus (B), genes enriched in tumor–derived mregDCs (C), genes enriched in efferocytic CD103+ DCs from small intestine (D). Normalized enrichment scores (NES) and false discovery rates (FDR) are listed in each panel. E. UMAP representation of single cell RNAseq of live, CD45.2+Zbtb46–YFP+ cells sorted from adult or neonatal lungs. Dashed outlines indicate clusters of cDC1, cDC2 and mature cDC1 cells. F. Expression of cDC1–defining genes. Dashed outline indicates clusters of cDC1 cells. G. Expression of cDC2–defining genes. Dashed outline indicates clusters of cDC2 cells. H. Expression of Mki67. I. Expression of maturation genes. Dashed outline indicates clusters of mature cDC1 cells. J. Expression of genes enriched in CD103int DCs. Dashed outline indicates clusters of CD103int cells. K. Expression of genes enriched in homeostatically mature DCs. Dashed outline indicates clusters of homeostatically mature DCs. Data are combined from two independent experiments. L-M. Naïve OT-I cells were cultured with sorted DC subsets loaded with OVA257–264 peptide and IFNγ expression was determined on day 4. This experiment was performed twice with 5 replicates for adult cDC1, 6 replicates for neonatal cDC1 and 5 replicates for neonatal CD103int DCs. Data are shown as mean ± SD. Significance was determined using 1-way ANOVA. *p<0.05, ****p<<0.0001.
