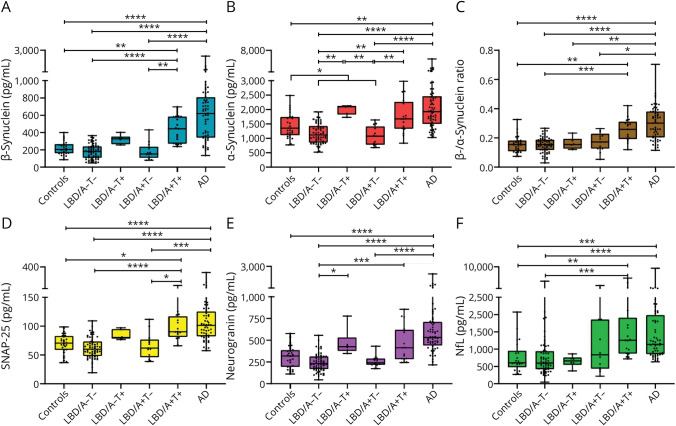
Figure 2. CSF Biomarkers Across AT(N)-Based Subgroups.
Panels show CSF levels of (A) β-synuclein, (B) α-synuclein, (C) β-/α-synuclein ratio, (D) SNAP-25, (E) neurogranin, and (F) NfL in Ctrls (n = 28), LBD/A−T− (n = 65), LBD/A−T+ (n = 6), LBD/A+T− (n = 13), LBD/A+T+ (n = 17), and AD (n = 60). *p < 0.05; **p < 0.01; ***p < 0.001; and ****p < 0.0001. AD = Alzheimer disease; AT(N) = amyloid-tau-neurodegeneration; Ctrls = controls; LBD = Lewy body disease; NfL = neurofilament light chain protein; SNAP-25 = synaptosomal-associated protein 25.

