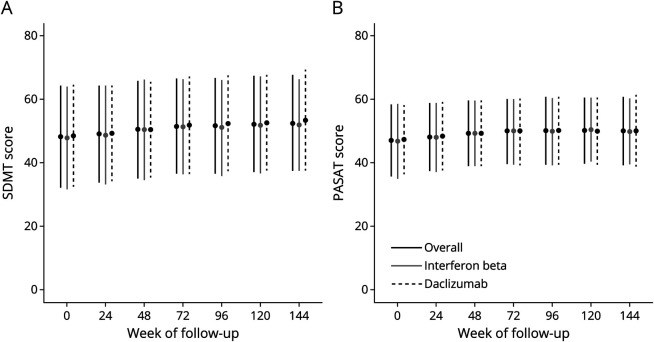
Figure 1. Mean Cognitive Outcome Scores During Follow-up.
Mean SDMT (A) and PASAT (B) scores throughout follow-up. Error bars represent the SD. Mean scores on both instruments steadily increase throughout follow-up, likely due to a practice effect of the repeated application of the measures. There is little difference between the treatment arms in cognitive scores.

