
Figure 1. Scatter-Dot Plot Representing the Correlation Between CSF PDGFRβ and Age in the Whole Sample (n = 771).
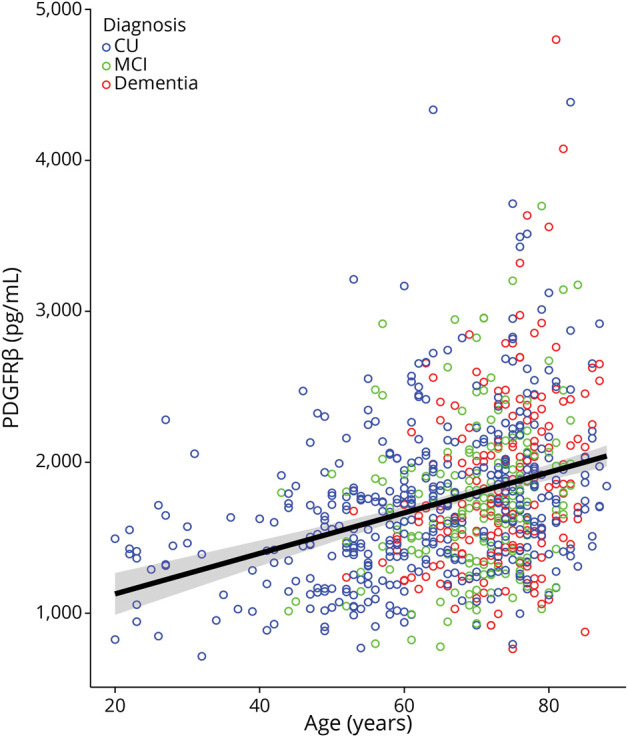
CU participants, participants with MCI, and participants with dementia shown in blue, green, and red, respectively. Regression line with 95% CIs is not adjusted for covariates. CU = cognitively unimpaired; MCI = mild cognitive impairment; PDGFRβ = platelet-derived growth factor β.