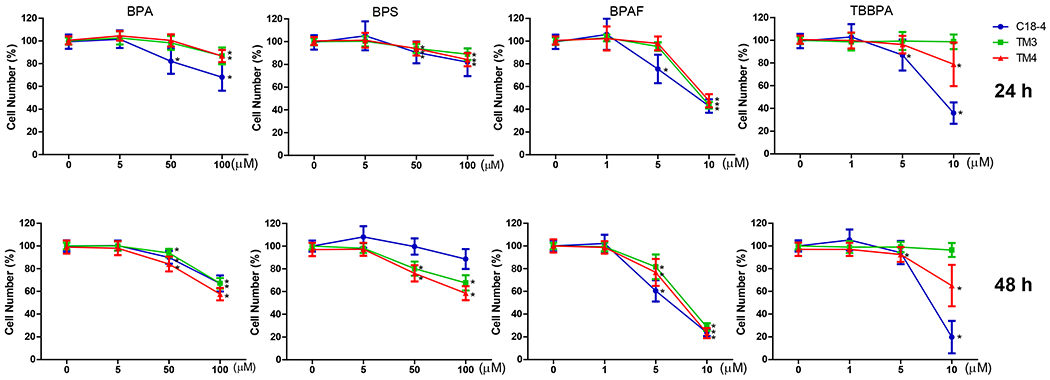
Figure 1. High-content image-based analysis (HCA) of single cell numbers changes in C18-4 spermatogonial cells, TM3 Leydig cells, and TM4 Sertoli cells.

Cells were treated with various concentrations of BPA and BPS (5, 50, and 100 μM), and BPAF and TBBPA (1, 5, and 10 μM) for 24 and 48 h. Data were presented as mean ± SD, n = 10. Five bilogical replicates in two independent experiments were included. One-way ANOVA conducted statistical analysis followed by Tukey-Kramer multiple comparisons (*P < .05).
