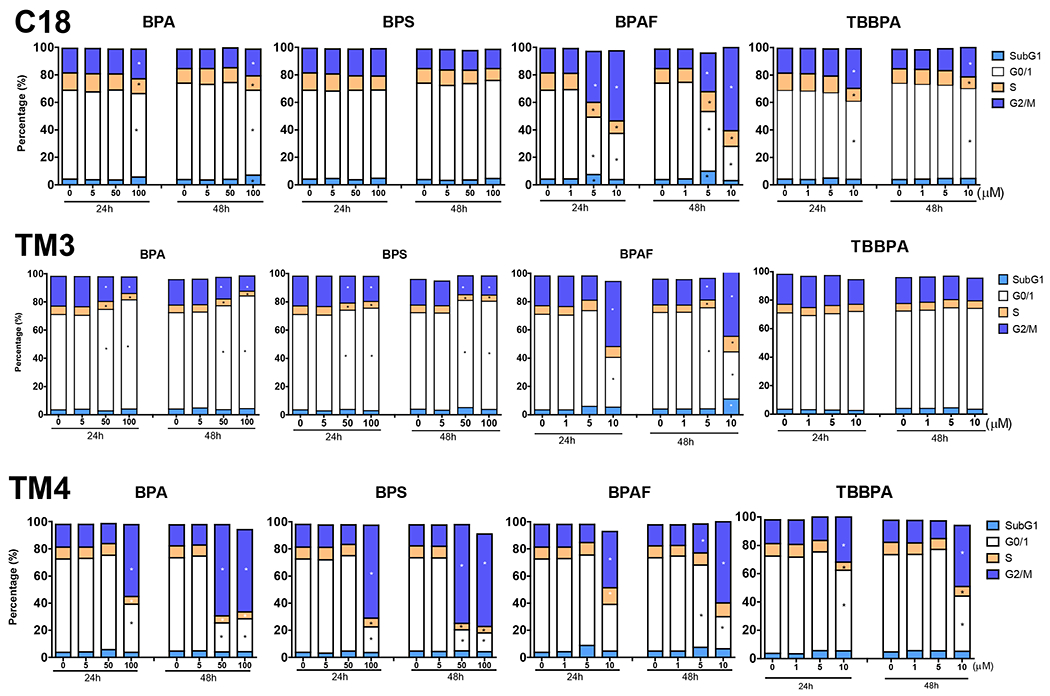
Figure 3. Cell cycle analysis of C18-4 spermatogonial cells, TM3 Leydig cells, and TM4 Sertoli cells.

Cells were treated with various concentrations of BPA and BPS (5, 50, and 100 μM), and BPAF and TBBPA (1, 5, and 10 μM) for 24 and 48 h. The percentage of cells in each cell cycle stage was determined by creating gating parameters on histograms of total DNA intensity per cell (by Hoechst 33342 staining) per well at sub-G1, G0/G1, S, and G2M phases using Python script.
Data were presented as mean ± SD, n = 10. Five replicates in two independent experiments were included. One-way ANOVA conducted statistical analysis followed by Tukey-Kramer multiple comparisons (*P < .05).
