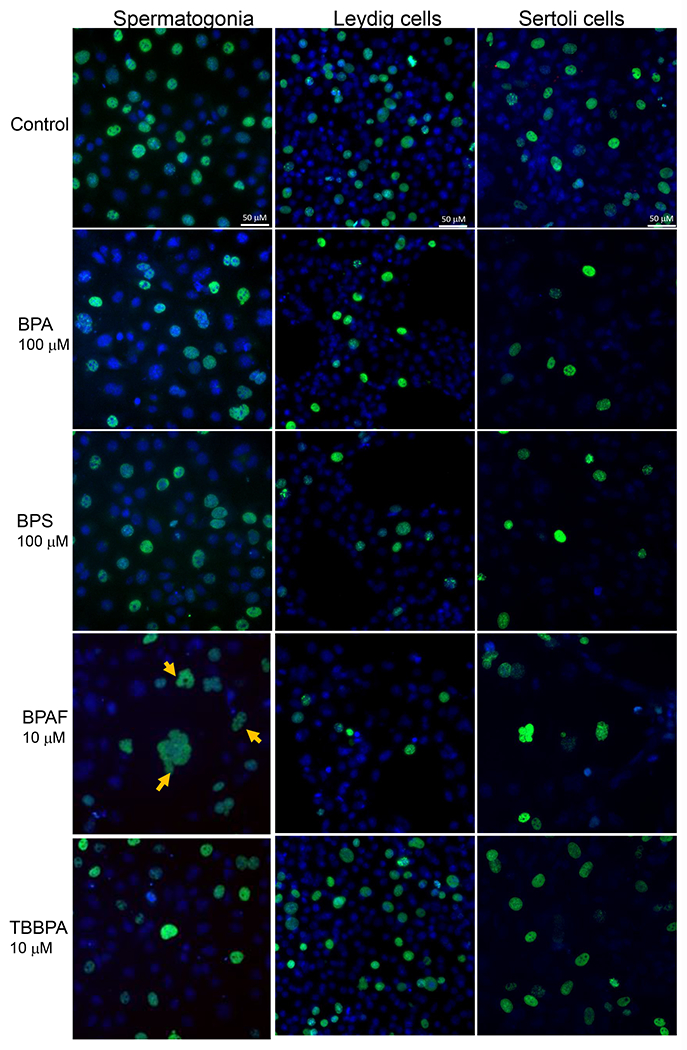
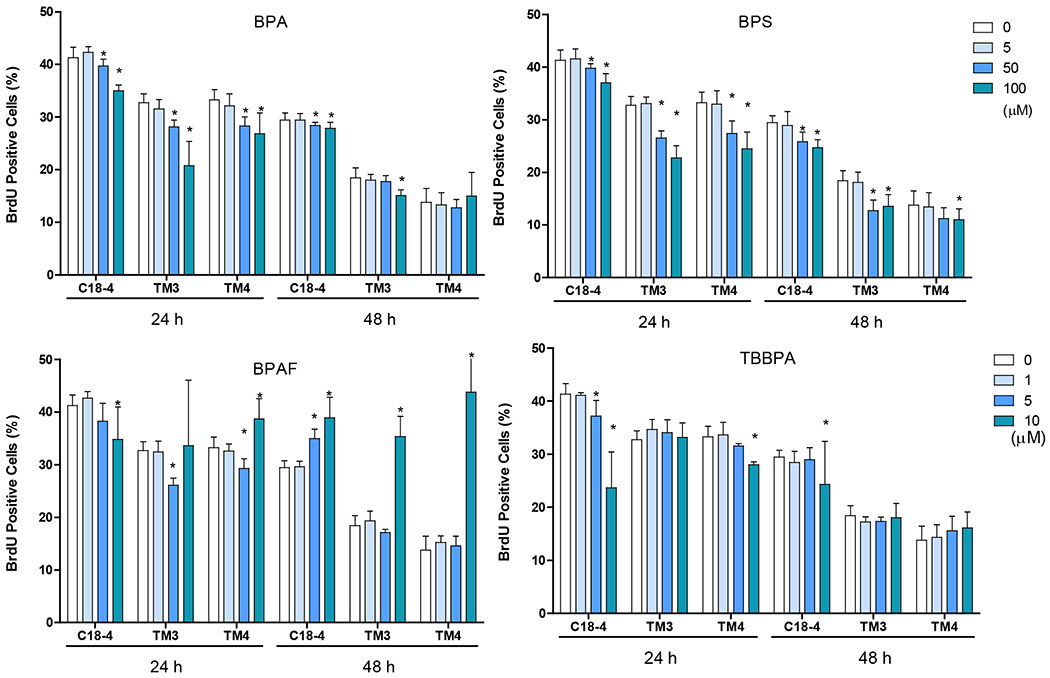
Figure 4. Effect of BPA and its analogs on DNA synthesis of C18-4 spermatogonial, TM3 Leydig and TM4 Sertoli cells.


A shows the representative images of BrdU incorporation in spermatogonial (C18-4), Leydig (TM3), and Sertoli (TM4) cells treated with BPA, BPS, BPAF, and TBBPA at various concentrations for 24h. The nuclei were stained with Hoechst 33342, BrdU positive labeling was pseudo-colored in green. Images were automatically obtained by ArrayScan HCA Reader with a 40× objective, 49 fields per well. Scale bar = 50 μm. B Quantification of BrdU incorporation (% BrdU positive cells vs Control) in the 3 testicular cell types treated with BPA and BPS (5, 50, and 100 μM) and BPAF and TBBPA (1, 5, and 10 μM) for 24 and 48 h. Single cell BrdU labeling data were quantified by HCS Studio™ 2.0 TargetActivation BioApplication. Data were presented as mean ± SD, n = 9. Three replicates in 3 separate experiments were included. Statistical analysis was conducted by 1-way ANOVA followed by Tukey-Kramer multiple comparisons (*P < .05).
