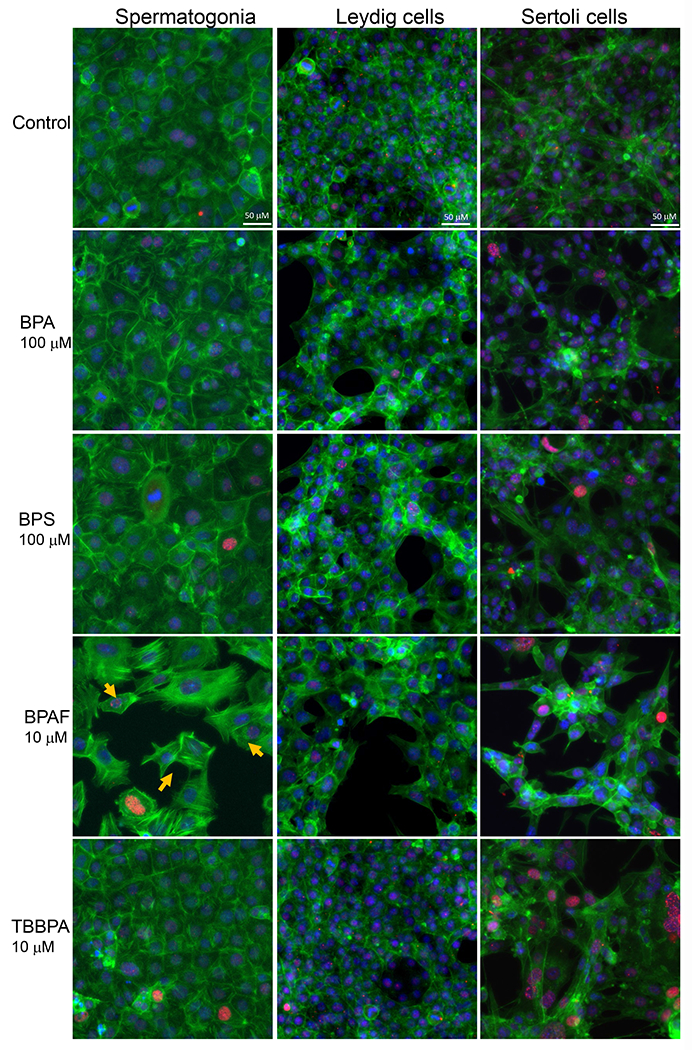
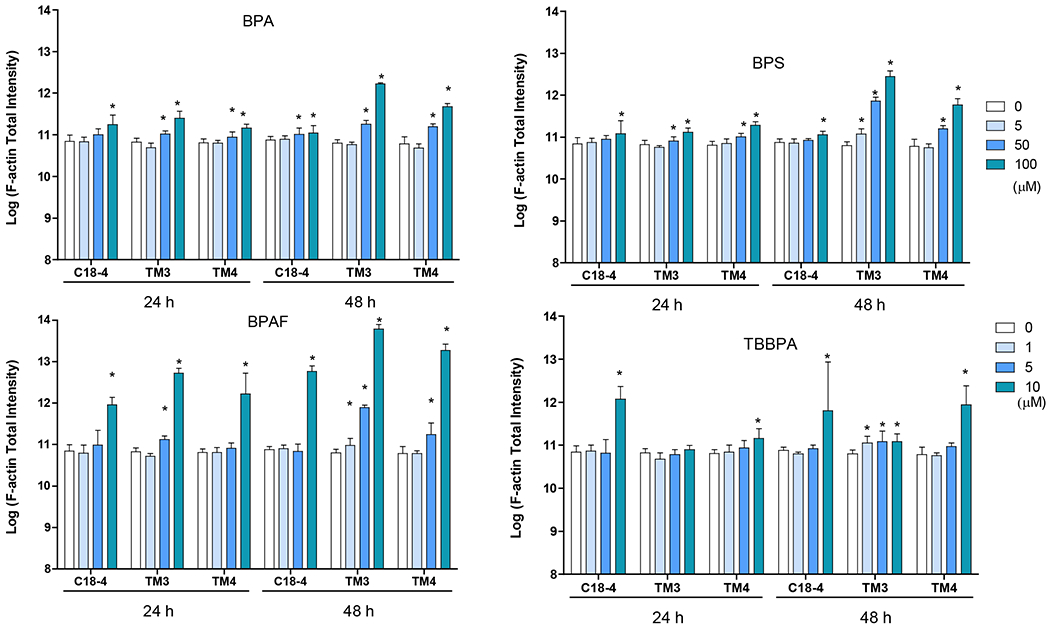
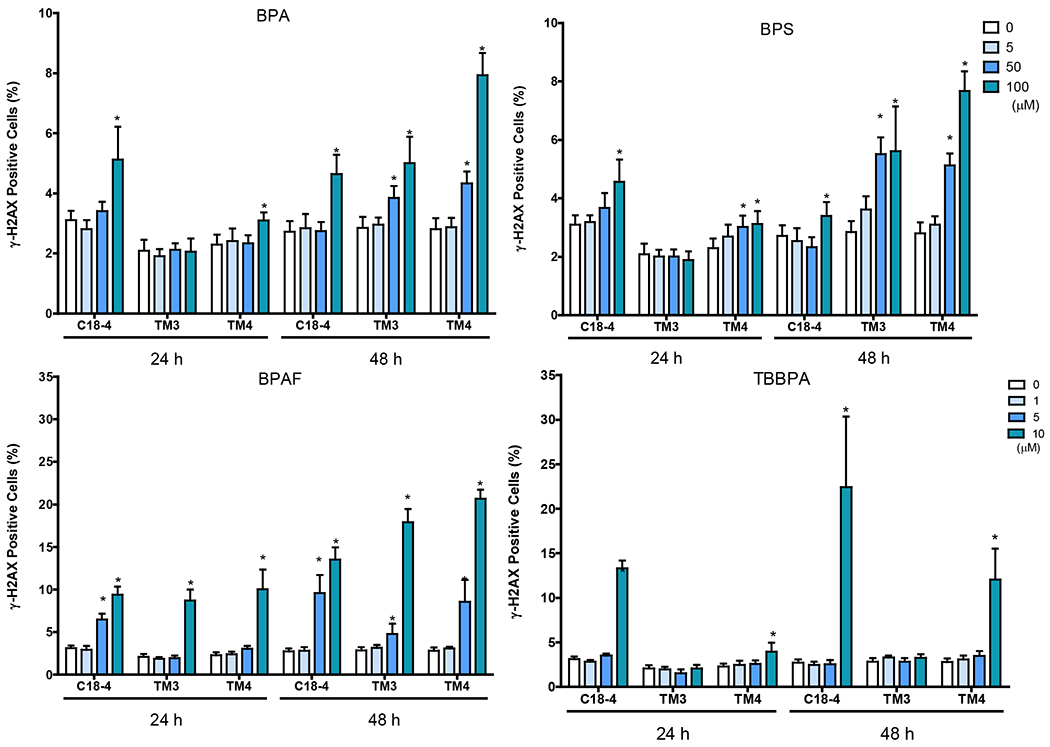
Figure 5. BPA and its analogs differentially perturbed cytoskeleton (F-actin) and induced early DNA damage responses (γH2AX) in spermatogonial (C18-4), Leydig (TM3), and Sertoli cells (TM4).


Cells treated with vehicle (0.01% DMSO) were used as negative controls. The nuclei were stained with Hoechst 33342 (blue), F-actin with Phalloidin staining (green), and γ-H2AX with a combination of primary phosphorylated γ–H2AX and secondary Dylight 650 conjugated antibody (red). A shows the representative images of cells treated with BPA and BPS (100 μM), BPAF and TBBPA (10 μM) for 24 h. Arrows indicate dot-like structures. Scale bar = 50 μm. B-C shows the single-cell quantification of the log-transformed total intensity of F-actin (B) and positive γ-H2AX cells (C) of the three testicular cell types treated with various BPA, BPS, BPAF and TBBPA concentrations for 24 and 48h. Data were presented as mean ± SD, n = 6. Three replicates in two separate experiments were included. Statistical analysis was conducted by 1-way ANOVA followed by Tukey-Kramer multiple comparisons (*P < 0.05).
