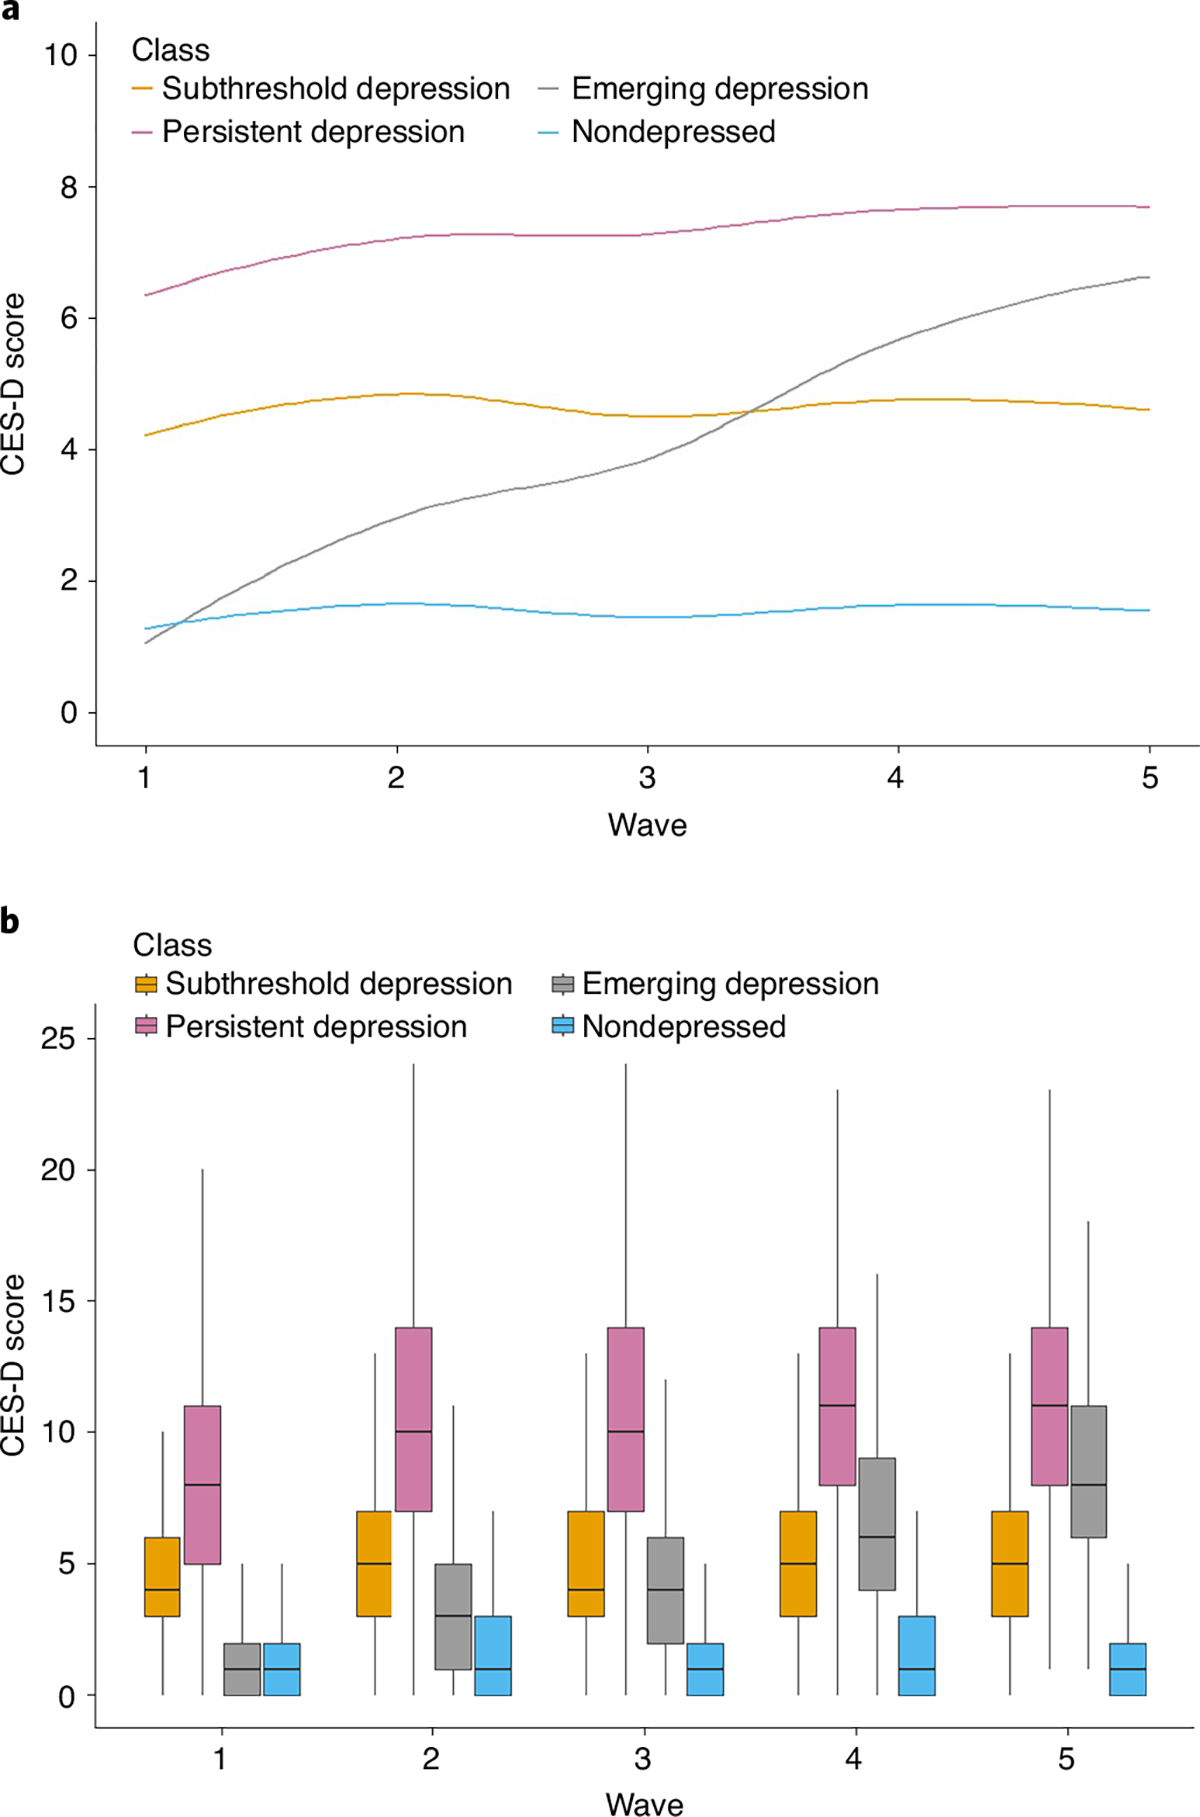
Fig. 1 |. Trajectory of depressive symptoms.

a, Model-based trajectory patterns according to latent class model. b, Summary descriptive of classes across the waves. Data are presented as Loess curves (a) and box plot graphs (b) showing the relationship between group membership and CES-D scores across follow-up (n = 19,110). b, Boxes show interquartile range, with solid horizontal lines representinging the median. Upper whiskers extend from the hinge to the highest value no further than 1.5× interquartile from the hinge; lower whiskers extend from the hinge to the lowest value no further than 1.5× interquartile from the hinge.
