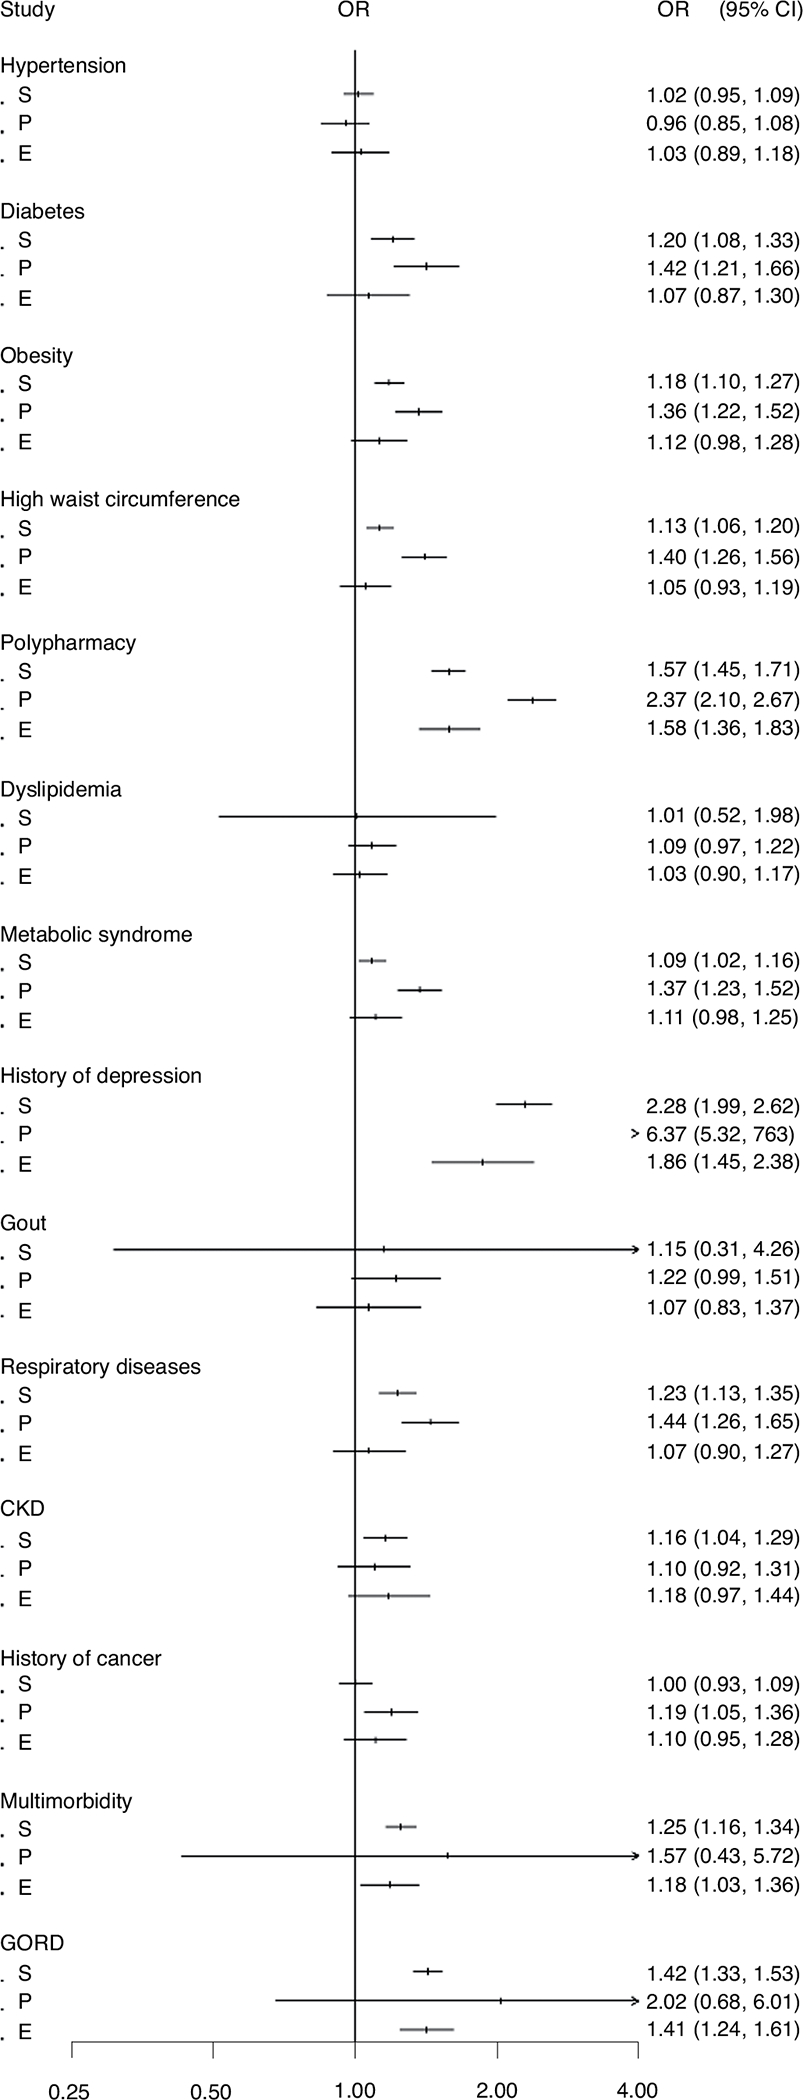
Fig. 2 |. Association between latent class membership and medical comorbidities at baseline.

Data are presented as a forest plot reporting OR as dots and 95% CI as error bars from the logistic regression model, with comorbidity at baseline as the dependent variable and group membership as the independent variable (n = 19,110). The model was adjusted for age, gender, living status, race, education, smoking, alcohol, body mass index, PCS, MCS, number of comorbidities and polypharmacy. S, subthreshold depression class; P, persistent depression class; E, emerging depression class.
