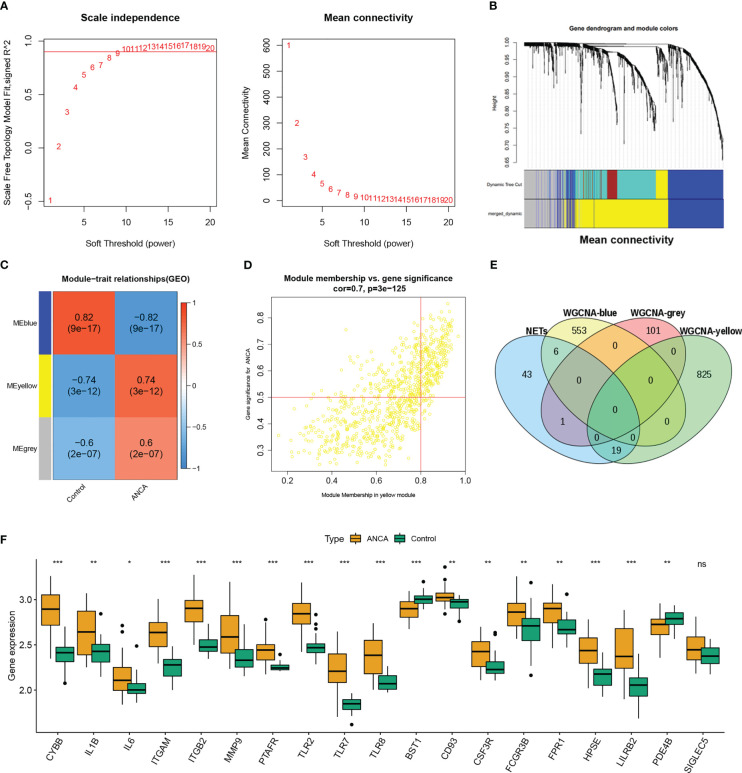
Figure 2.
Construction of WGCNA modules. (A) Soft threshold β=9 and scale–free topological fit index (R2). (B) Shows the original and combined modules under the clustering tree. (C) Heatmap of the module-trait relationships. (D) Scatter plot for correlation between gene module membership in the yellow module and gene significance. (E) Venn diagram of WGCNA module genes and NETs. (F) Box plot shows the differential expression of 18 DE-NETs between healthy control and ANCA-GN. WGCNA, weighted gene co-expression network analysis; ANCA-GN, anti-neutrophil cytoplasmic antibody associated glomerulonephritis; DE-NETs, differentially expressed neutrophil extranuclear traps related genes. *p < 0.05; **p < 0.01; ***p < 0.001; ns, no significant difference.

