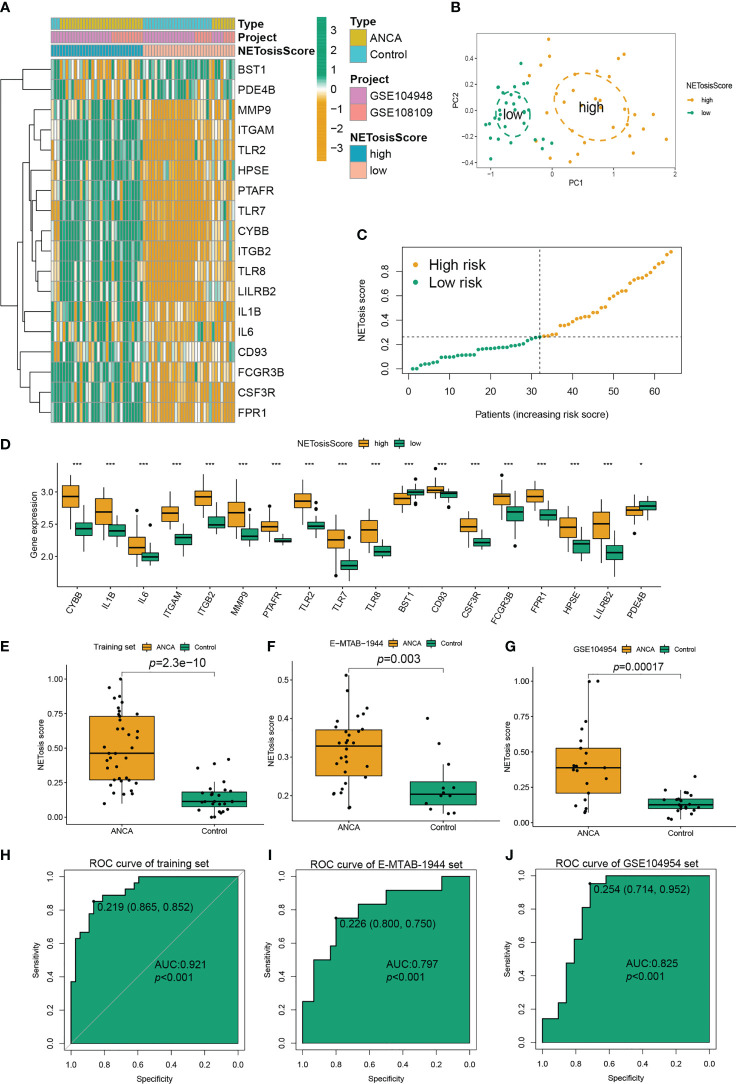
Figure 4.
Construction and verification of the NETosisScore model in ANCA-GN. (A) Expression profiles of the high-risk group and low-risk group of NETosisScore were constructed based on two cohorts (GSE104948 and GSE108109). (B) PCA between the high-risk and low-risk groups. (C) Boxplot showing the distribution of NETosisScore in healthy and ANCA-GN samples. (D) Boxplot illustrating the differences in expression levels of 18 DE-NETs between the high-risk and low-risk groups. (E) Boxplot of the distribution of NETosisScore in the training set. (F, G) ROC curves generated by the NETosisScore model in the validation set (E-MTAB-1994 and GSE104954). (H) Boxplot of the distribution of NETosisScore in the training set. (I, J) ROC curves generated by the NETosisScore model in the validation set (E-MTAB-1994 and GSE104954). ANCA-GN, anti-neutrophil cytoplasmic antibody-associated glomerulonephritis; PCA, Principal Component Analysis. *p < 0.05; ***p < 0.001.

