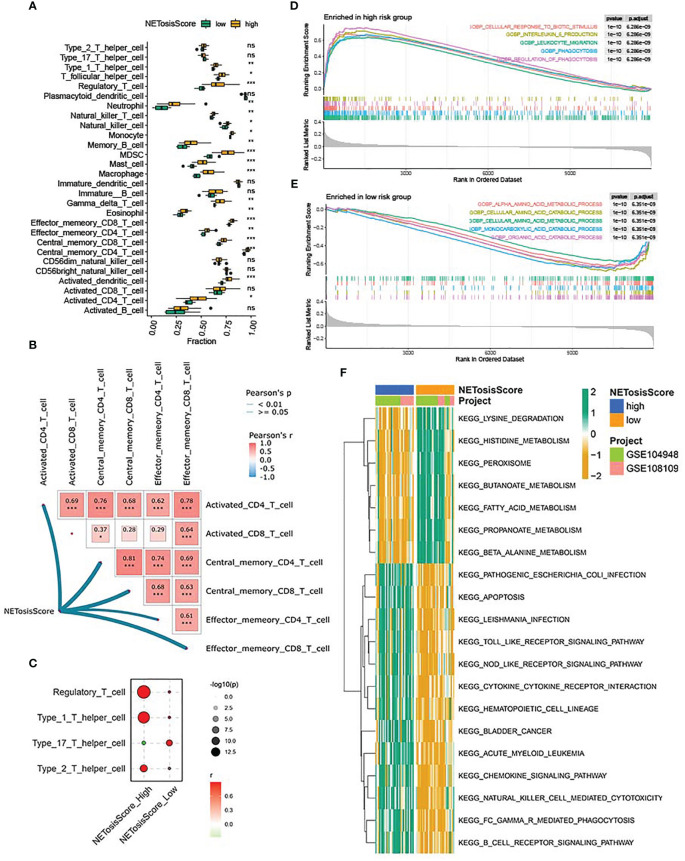
Figure 5.
Immune characteristics and functional enrichment analysis of NETosisScore subtypes. (A) Abundance differences of 28 infiltrating immune cells between NETosisScore subgroups. (B) NETosisScore correlation with CD4T cells and CD8T cells network heat map. (C) Correlation Bubble Plot of NETosisScore Groups with CD4 T Cell Subsets. (D, E) GSEA enrichment analysis of NETosisScore subtype in biological processes. (F) Differential enrichment of KEGG pathways among NETosisScore subtypes. *p < 0.05; **p < 0.01; ***p < 0.001; ns, no significant difference.

