
Figure 1.
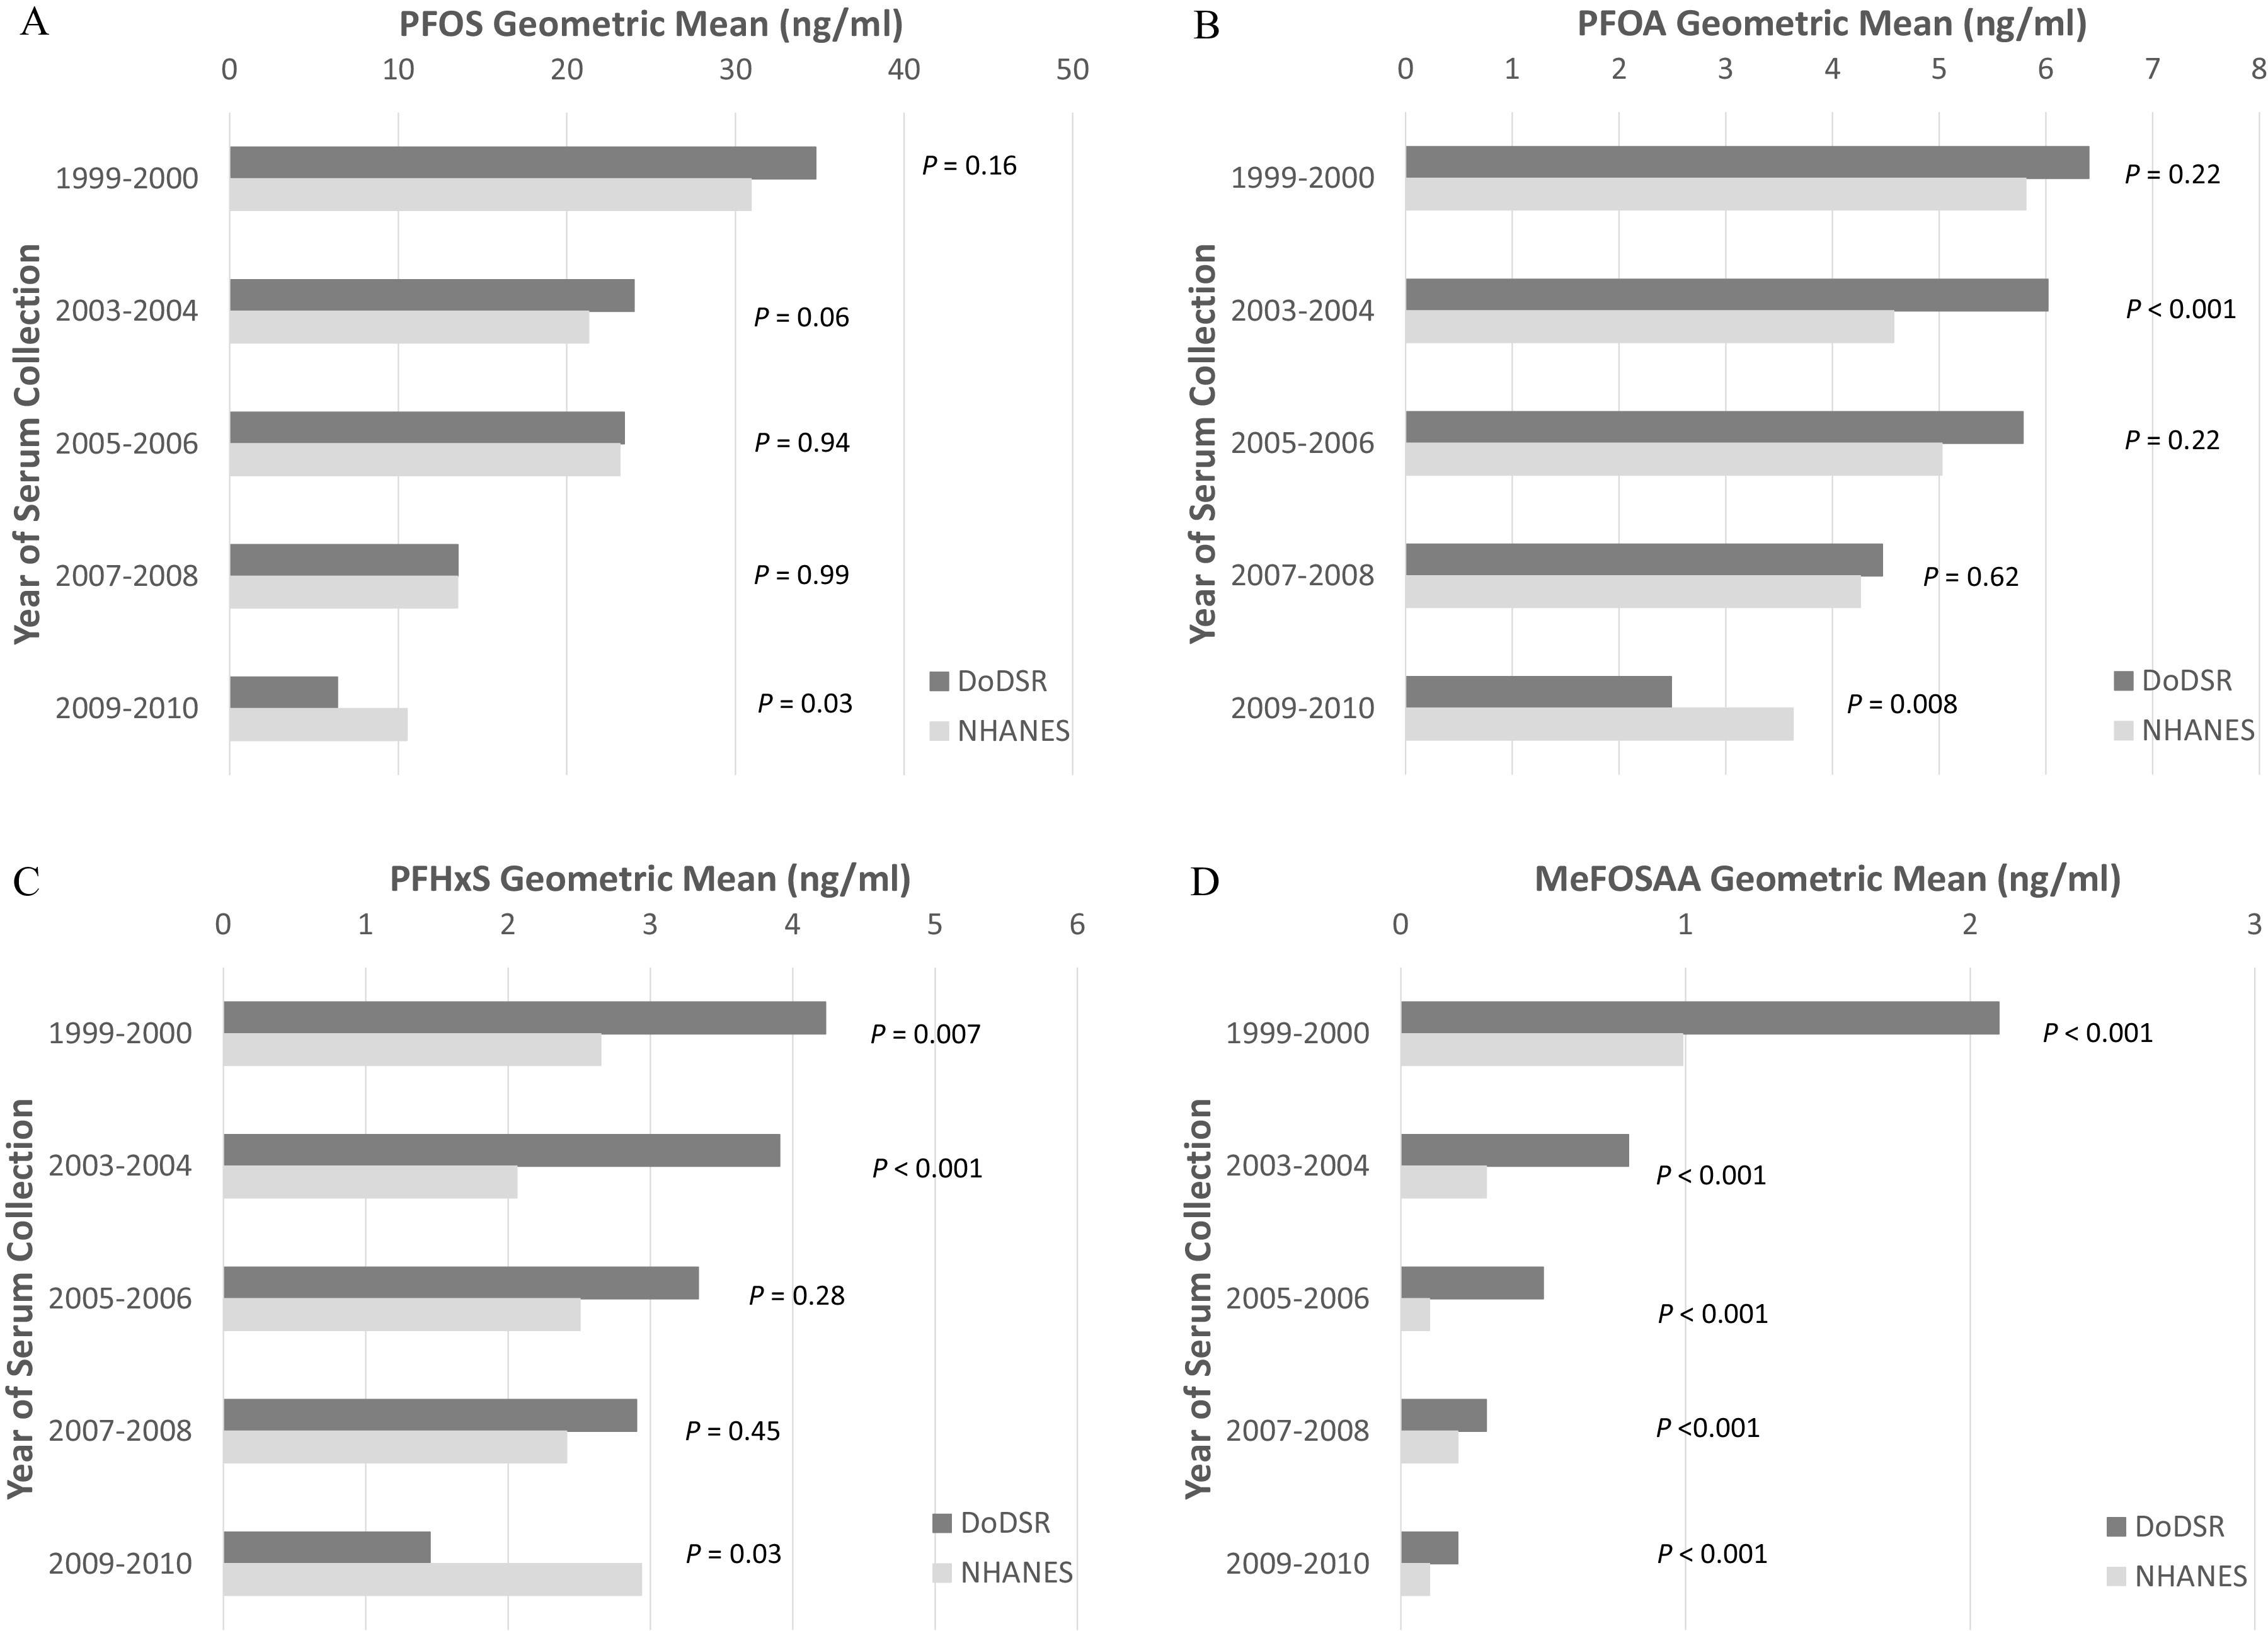
Comparisons of geometric mean serum concentrations (ng/mL) of selected PFAS in DoDSR Air Force study controls (first/only sample) vs. male participants age 18–39 y in the National Health and Nutrition Examination Survey (NHANES) for samples collected in 1999–2000 (controls, ; NHANES, ), 2003–2004 (controls, ; NHANES, ), 2005–2006 (controls, ; NHANES, ), 2007–2008 (controls, ; NHANES, ), and 2009–2010 (controls, ; NHANES, ). (A) PFOS; (B) PFOA; (C) PFHxS; (D) MeFOSAA. -Values are from Wilcoxon rank sum tests of difference in PFAS concentration between populations for a given sample collection period. The estimated geometric means of all seven evaluated PFAS in study controls and NHANES data are provided in Supplementary Table 2. Note: DoDSR, Department of Defense Serum Repository; MeFOSAA, 2-(N-methyl-perfluorooctane sulfonamido) acetic acid; NHANES, National Health and Nutrition Examination Survey; PFHxS, perfluorohexanesulfonic acid; PFOA, perfluorooctanoic acid; PFOS, perfluorooctanesulfonic acid.