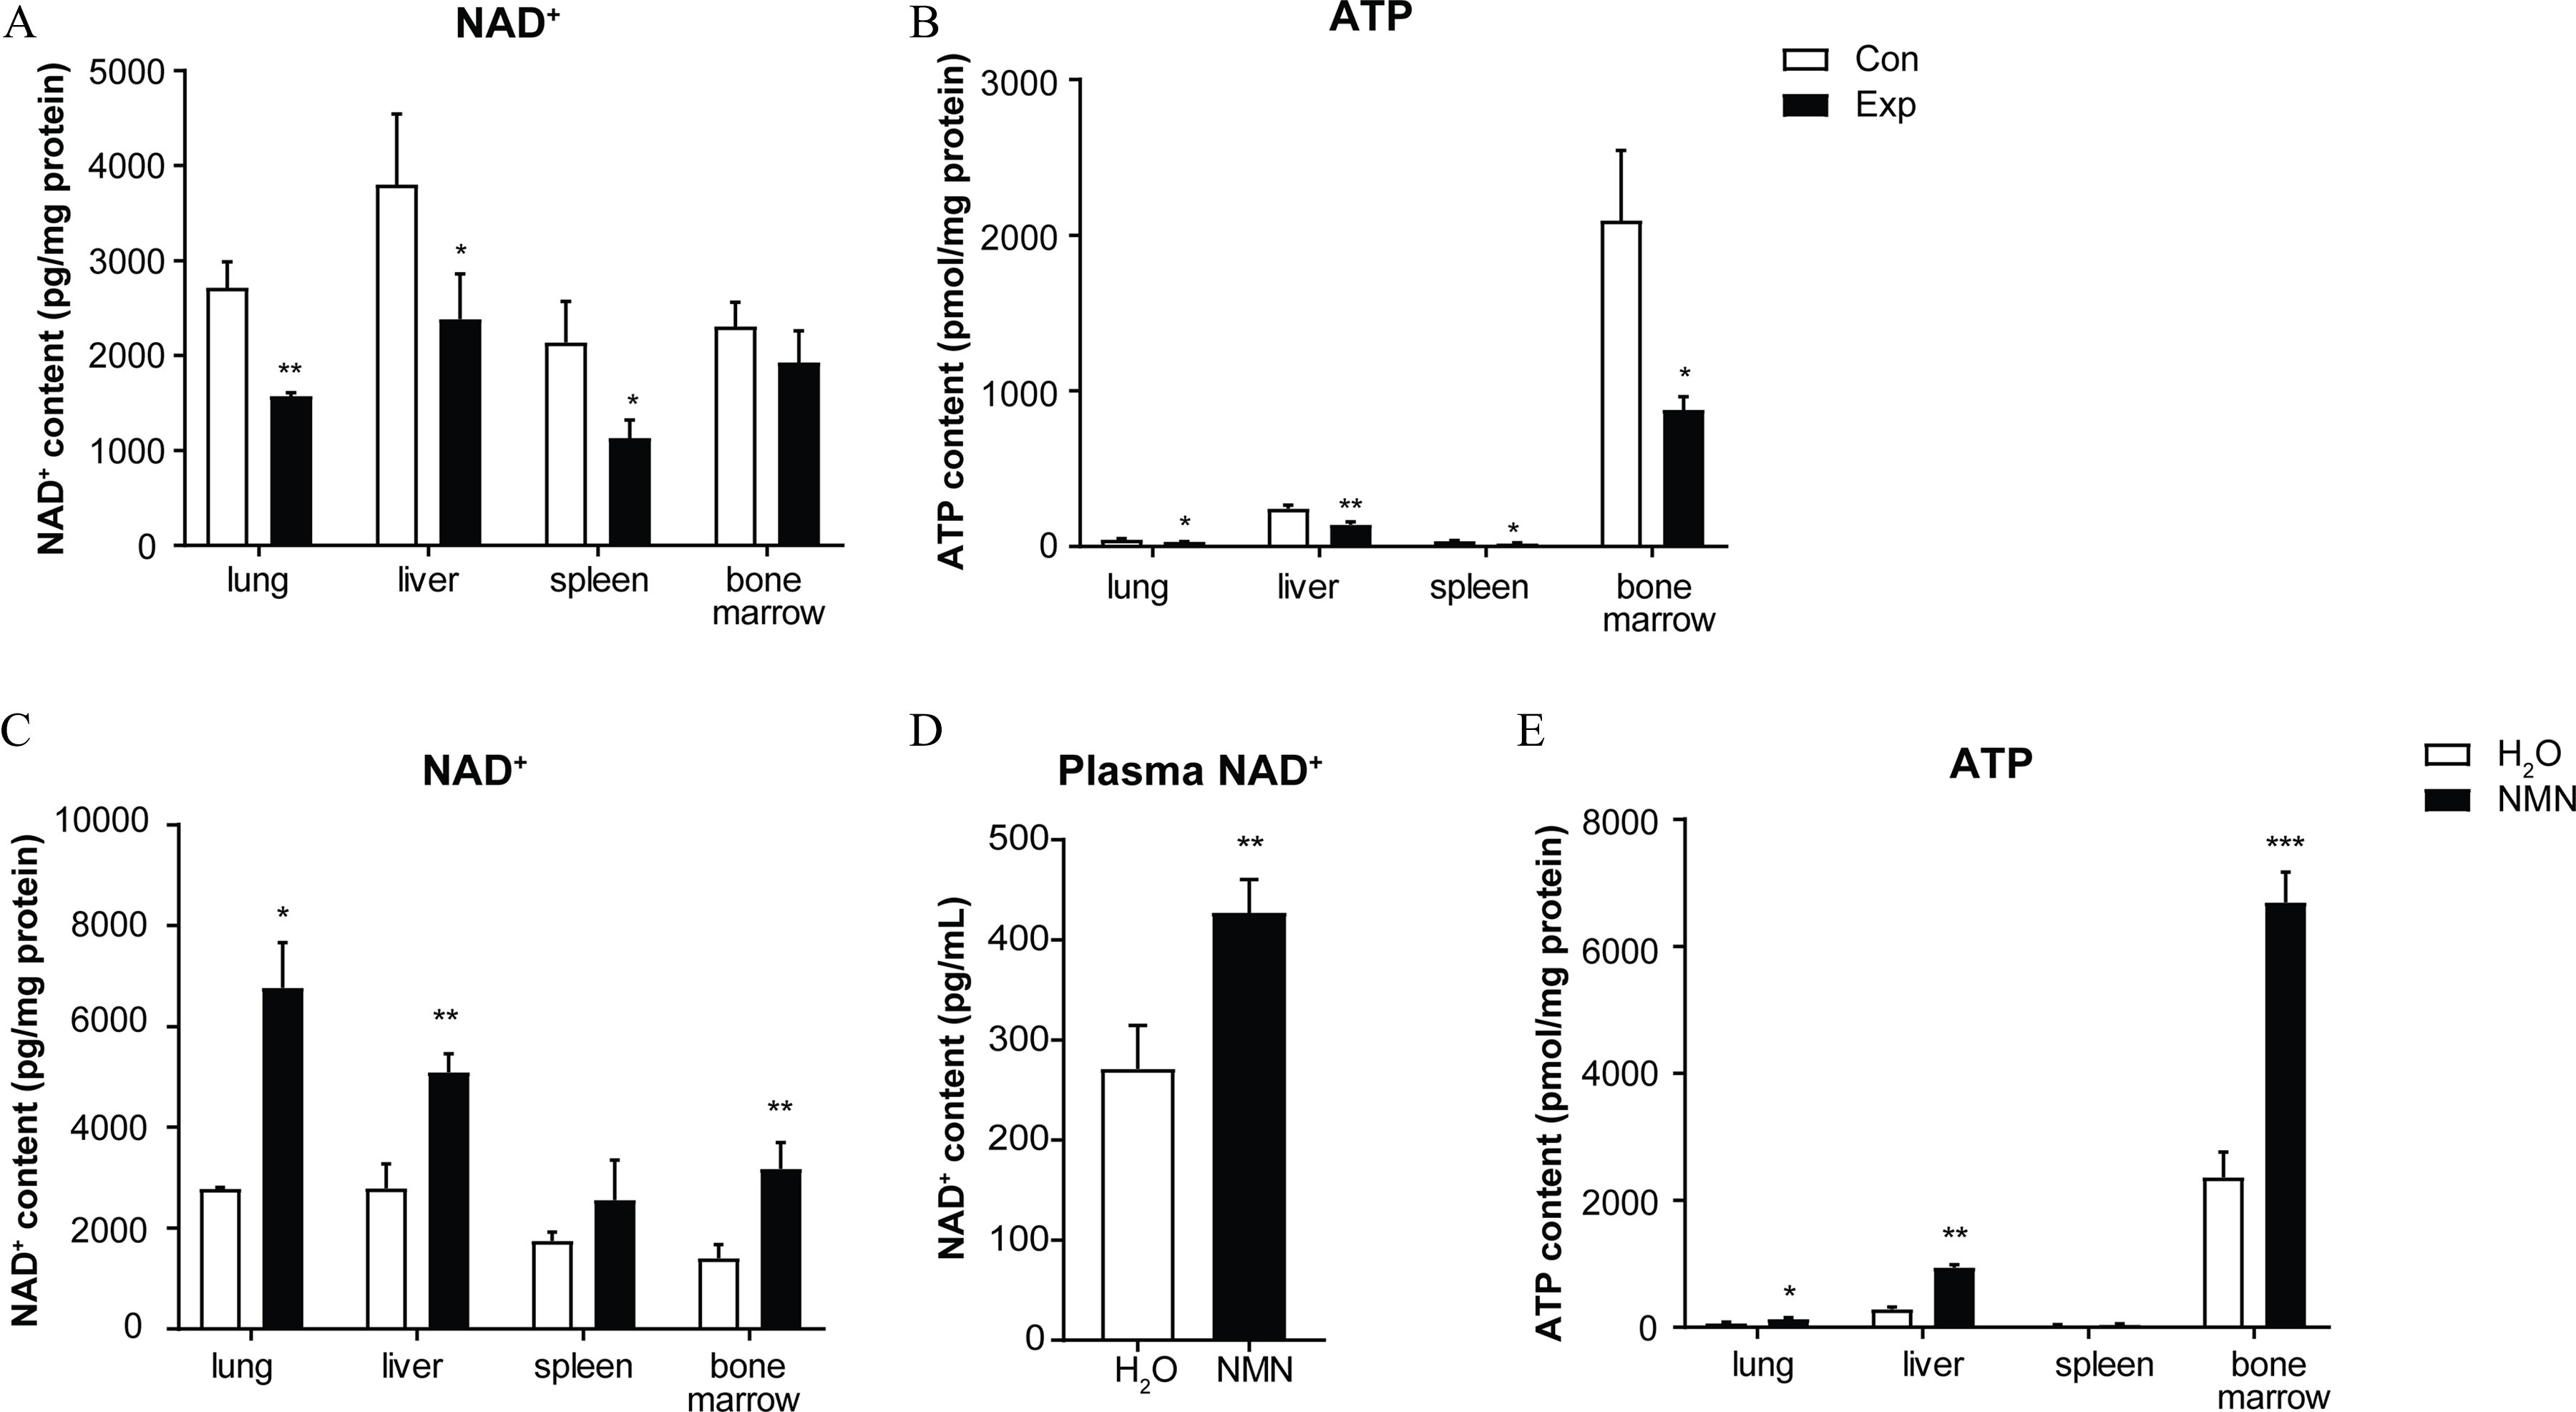
Figure 2.

NMN supplementation and and ATP content in mice exposed to PM. (A) levels measured in lung, liver, spleen, and bone marrow tissue in mice with (PM-exposed group, Exp) or without (air-filtered control group, Con) 16-wk PM exposure (/group). (B) ATP content was analyzed in lung, liver, spleen, and bone marrow tissue of Con and Exp groups at the end of PM exposure (/group). levels were analyzed in (C) lung, liver, spleen, and bone marrow tissue (/group) and (D) plasma (/group) of and NMN-BS groups. (E) ATP levels were examined in lung, liver, spleen, and bone marrow tissue (/group) of and NMN-BS groups. Data were analyzed using Student’s -test or the Wilcoxon rank sum test. The data are expressed as . The mean, SD, and SEM values for data are shown in Table S5. *, **, and *** compared with the corresponding control mice. -Values for all tests are reported in Table S6. Note: ATP, adenosine triphosphate; BS, baseline; Con, air-filtered control group; Exp, PM exposure group; , water; , nicotinamide adenine dinucleotide; NMN, nicotinamide mononucleotide; PM, particulate matter; SD, standard deviation; SEM, standard error of mean.
