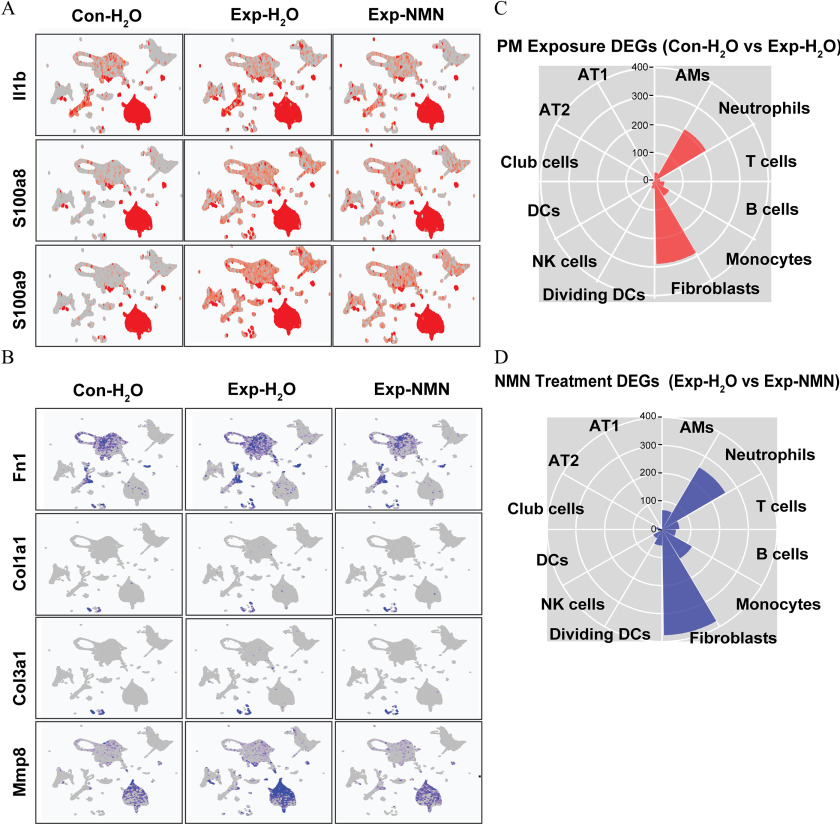
Figure 5.
Expression of pro-inflammatory and pro-fibrotic marker genes and illustration of DEGs (A) Expression levels of pro-inflammatory genes including Il1b, S100a8, and S100a9 on UMAP plots split by , , and Exp-NMN groups. (B) Expression levels of profibrotic genes including Fn1, Col1a1, Col3a1, and Mmp8 on UMAP plots split by , , and Exp-NMN groups. The numbers of (C) “PM Exposure DEGs” ( vs. ) and (D) “NMN Treatment DEGs” (Exp-NMN vs. ) identified in each cell cluster are displayed in rose diagrams. The corresponding data of (A) and (B) are listed in Excel Table S9. The detailed information of the genes summarized in (C) and (D) are provided in Excel Tables S4 and S5. Note: AM, alveolar macrophages; AT1, type 1 alveolar epithelial cells; AT2, type 2 alveolar epithelial cells; Con, air-filtered control group; DC, dendritic cells; DEGs, differentially expressed genes; dividing DC, dividing dendritic cells; Exp, PM exposure group; , water; Monocytes, monocyte-derived cells; NK, NK cells; NMN, nicotinamide mononucleotide; PM, particulate matter; UMAP, Uniform Manifold Approximation and Projection.

