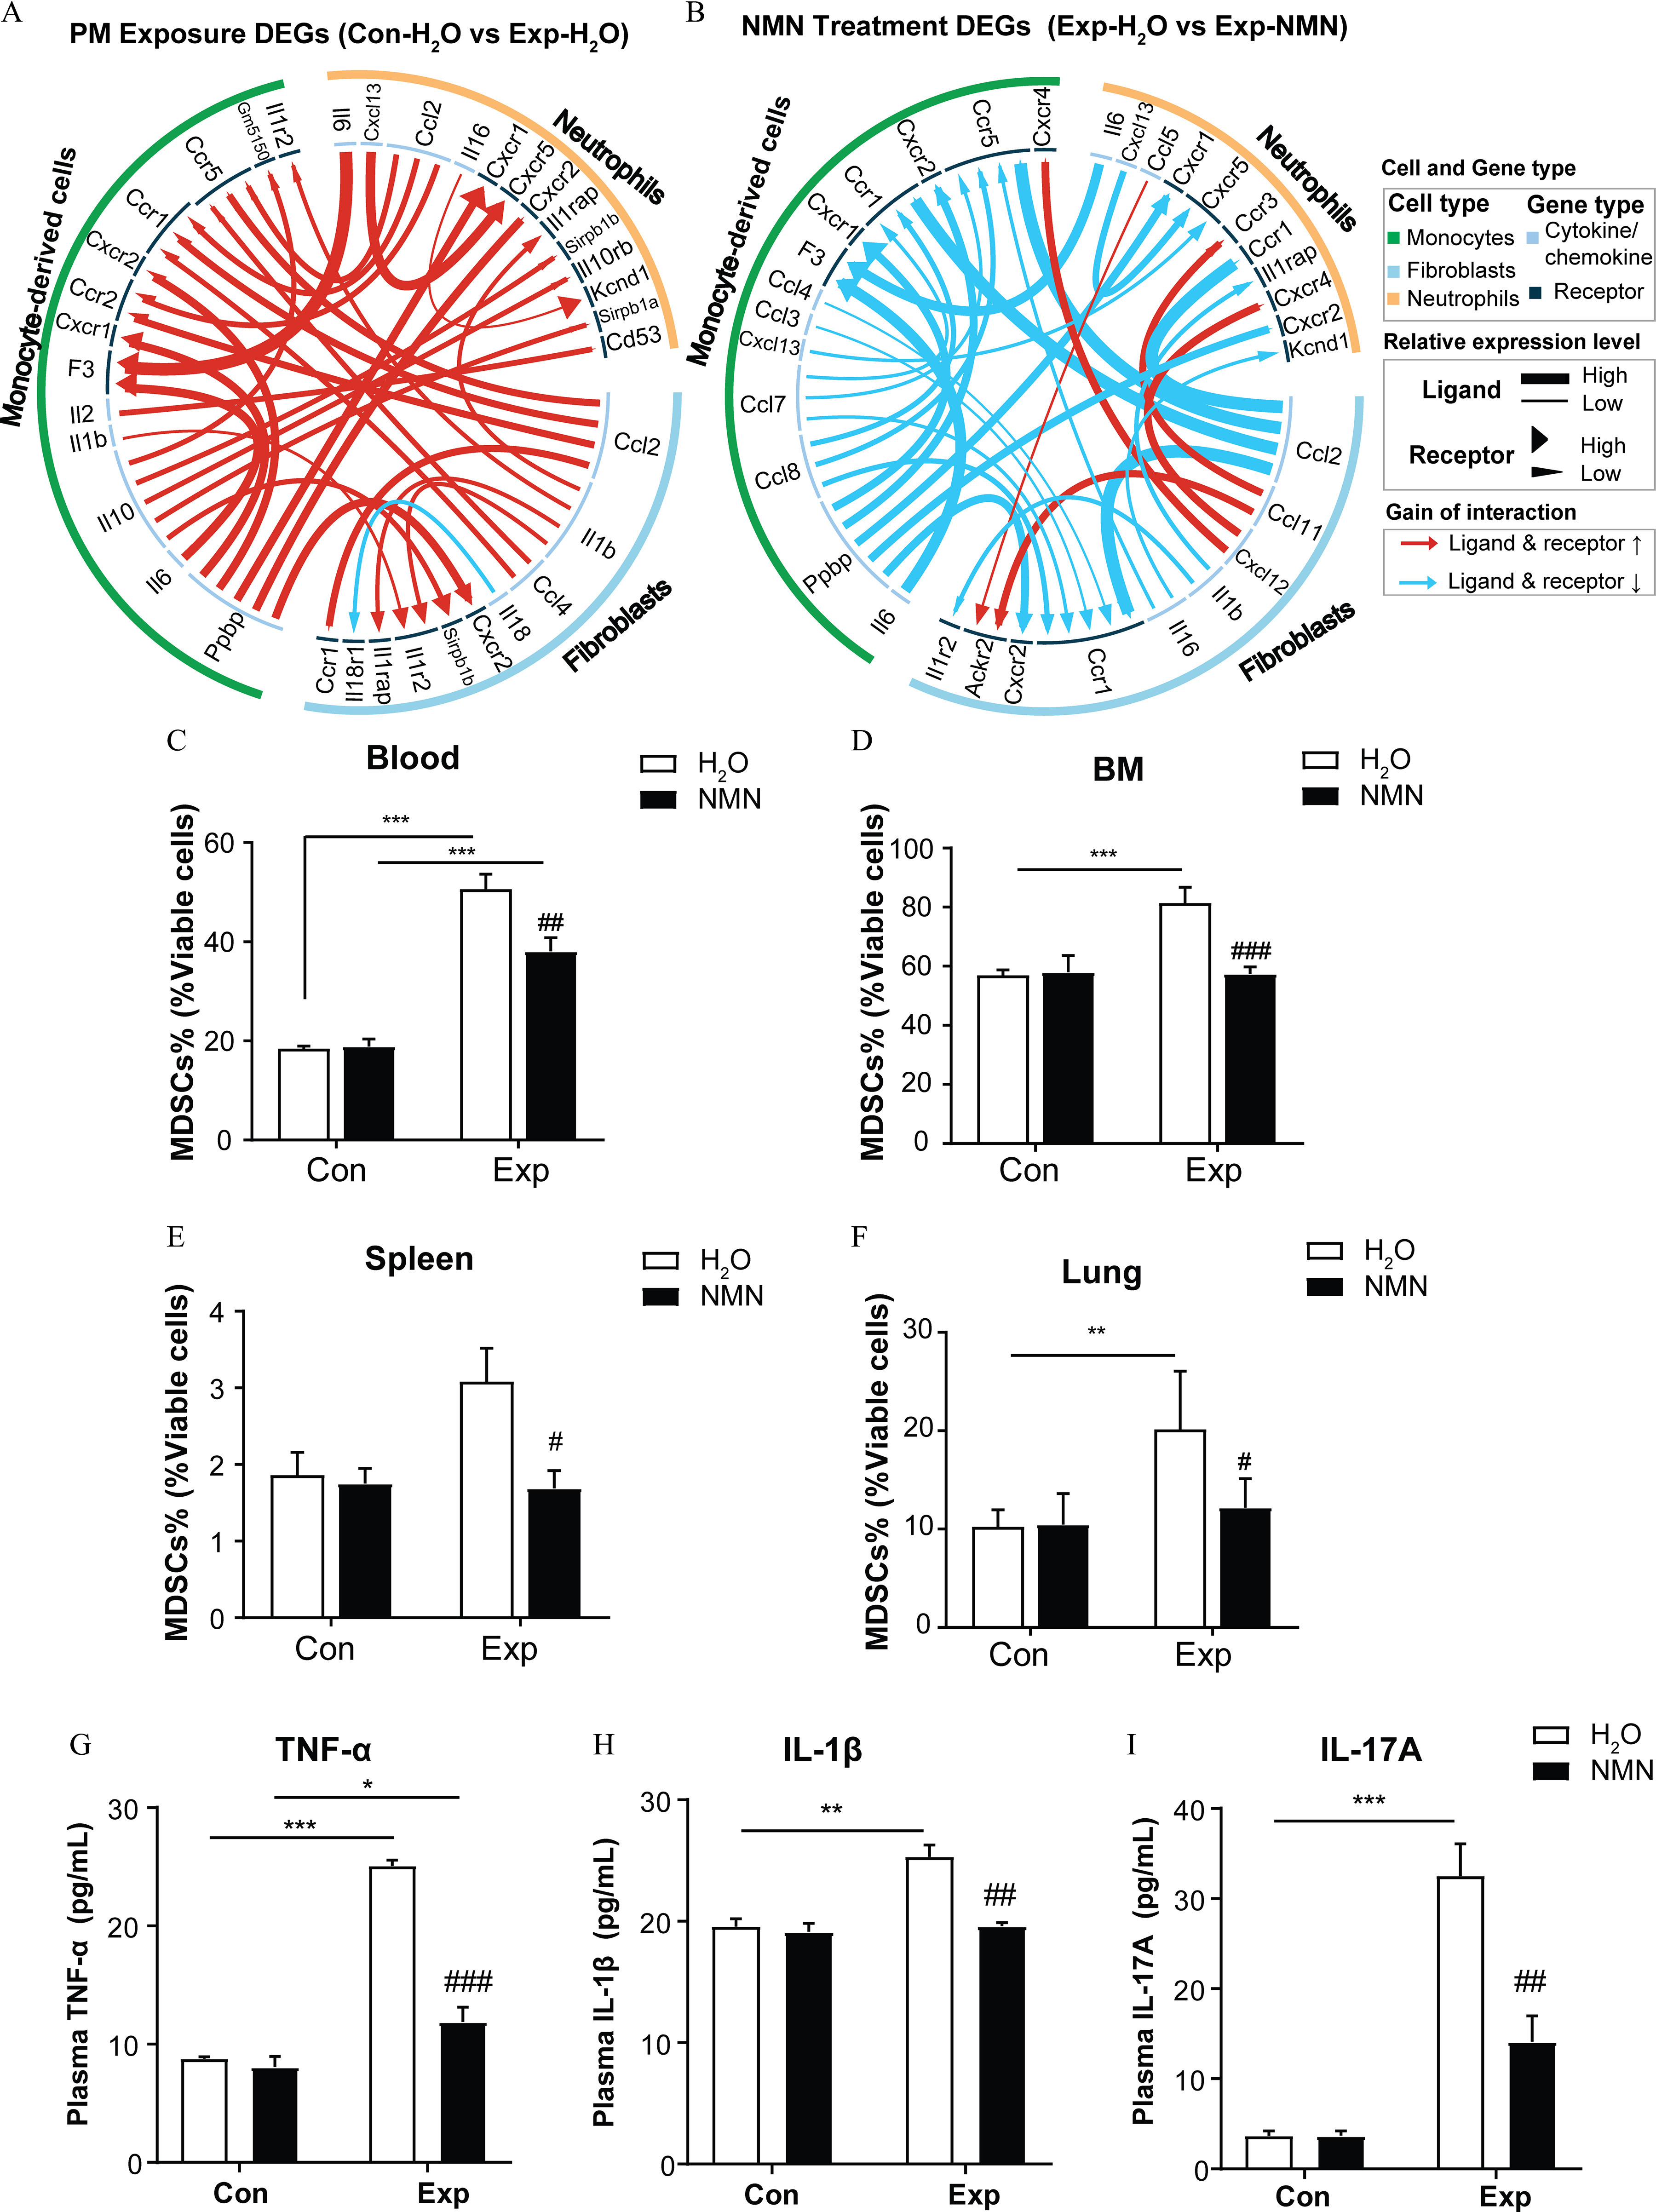
Figure 6.

NMN supplementation and markers of immunosuppression in mice exposed to PM. Circos plots are visualized for significant alterations in cellular cytokine interactions among neutrophils, monocyte-derived cells, and fibroblasts based on (A) “PM Exposure DEGs” ( vs. ) and (B) “NMN Treatment DEGs” (Exp-NMN vs. ). The summary data of the top 30 ligand–receptors displayed in (A) and (B) are shown in Excel Table S2. The proportions of MDSCs measured in the viable cells of (C) peripheral blood (/group), (D) bone marrow (/group), (E) spleens (/group), and (F) lungs (/group) of mice in control and PM-exposed groups with or without NMN supplementation. (G) (/group), (H) (/group), and (I) IL-17A (/group) (I) in mouse plasma from , , Con-NMN, and Exp-NMN groups as determined by ELISA assays. Data presented in (C–I) were analyzed using one-way ANOVA followed by Tukey’s multiple comparison post hoc test or the Kruskal–Wallis test followed by Dunn’s multiple comparisons test where appropriate. The results in the bar graphs are presented as . The summary data (mean, SD, and SEM values) of the bar graphs in this figure are shown in Table S5. *, **, and ***. #, ##, and ### compared with the mice (Exp-NMN vs. ). -Values for all tests are reported in Table S6. Note: ANOVA, analysis of variance; BM, bone marrow; Con, air-filtered control group; DEGs, differentially expressed genes; ELISA, enzyme-linked immunosorbent assay; Exp, PM exposure group; , water; MDSCs, myeloid-derived suppressor cells; NMN, nicotinamide mononucleotide; PM, particulate matter; SD, standard deviation; SEM, standard error of mean; TNF, tumor necrosis factor.
