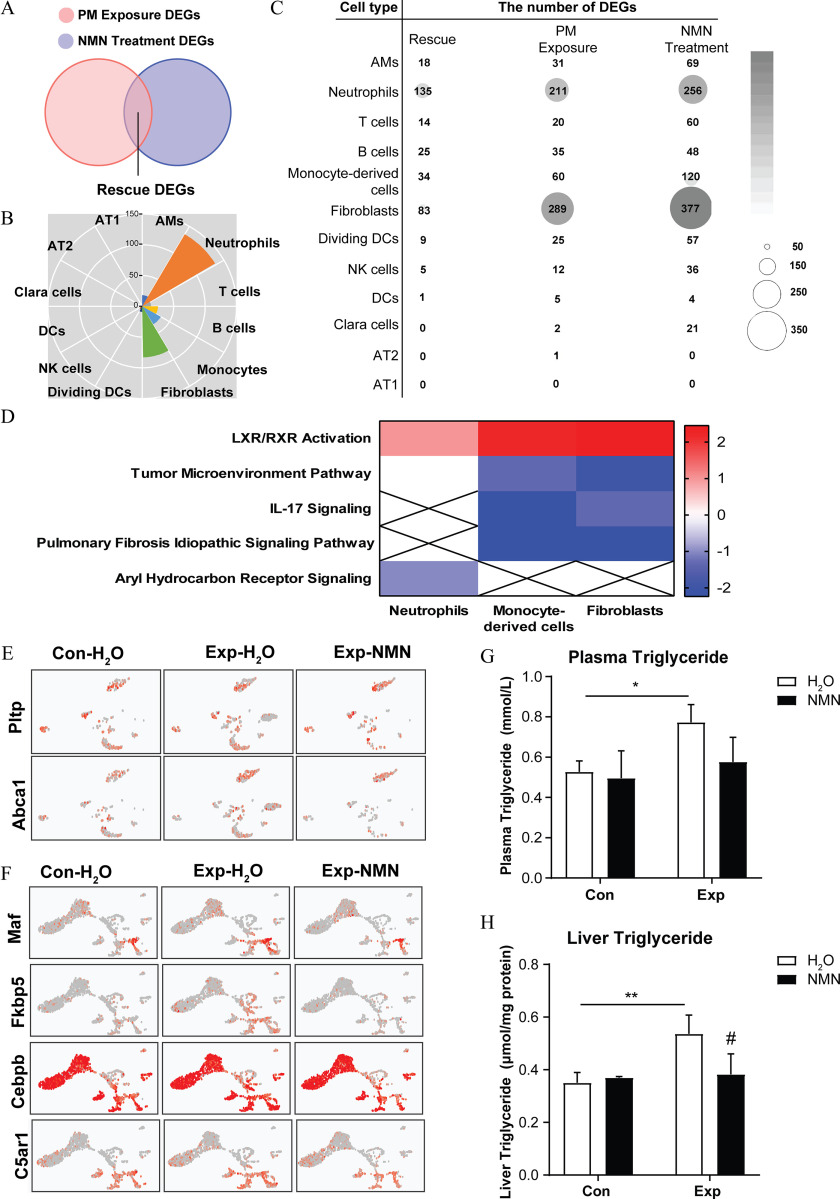
Figure 8.
NMN supplementation and markers of lipid metabolism in critical cell clusters in mice exposed to PM. (A) Schematic Venn diagram of overlapping “rescue” DEGs identified by integration analysis between “PM Exposure DEGs” ( vs. ) and “NMN Treatment DEGs” (Exp-NMN vs. ). The corresponding data are shown in Excel Table S6. (B) Identified “rescue” DEGs of each cell cluster are visualized in a rose diagram. (C) The bubble matrix displays the numbers of “rescue” DEGs (Rescue), “PM Exposure DEGs” (PM Exposure) and “NMN Treatment DEGs” (NMN Treatment). (D) The heatmap illustrates the overlapping enriched canonical pathways analyzed using Ingenuity Pathway Analysis (IPA) software (Qiagen) among neutrophils, monocyte-derived cells, and fibroblasts based on “rescue” DEGs. The -scores, from the lowest to the highest, are colored from blue to red, whereas a cross indicates when -scores were unable to be calculated owing to a lack of sufficient evidence. The corresponding -scores for each enriched pathway of the respective cell clusters are displayed in Table S9. (E) The expression of Pltp and Abca1 in fibroblast subsets of mouse lungs from , , and Exp-NMN groups are shown in UMAP plots. (F) The expression of Maf, Fkbp5, Cebpb, and C5ar1 in monocyte-derived cell subsets of mouse lungs from , , and Exp-NMN groups are shown in UMAP plots. The triglyceride (TG) levels examined in (G) mouse plasma (/group) and (H) mouse liver tissues (/group) from the , , Con-NMN, and Exp-NMN groups, respectively, at the end of the subchronic PM exposure. The expression levels of genes in (E) and (F) are listed in Excel Table S11. Data in (G) and (H) were analyzed using one-way ANOVA followed by Tukey’s multiple comparison post hoc test. The results are presented as . The mean, SD, and SEM values of the bar graphs in (G) and (H) are summarized in Table S5. **, compared with mice. # compared with the mice (Exp-NMN vs. ). -Values for all tests are shown in Table S6. Note: AM, alveolar macrophages; ANOVA, analysis of variance; AT1, type 1 alveolar epithelial cells; AT2, type 2 alveolar epithelial cells; Con, air-filtered control group; DC, dendritic cells; DEGs, differentially expressed genes; dividing DC, dividing dendritic cells; Exp, PM exposure group; , water; IL, interleukin; LXR, liver X receptor; NMN, nicotinamide mononucleotide; PM, particulate matter; RXR, retinoid X receptor; SD, standard deviation; SEM, standard error of the mean; UMAP, Uniform Manifold Approximation and Projection.

