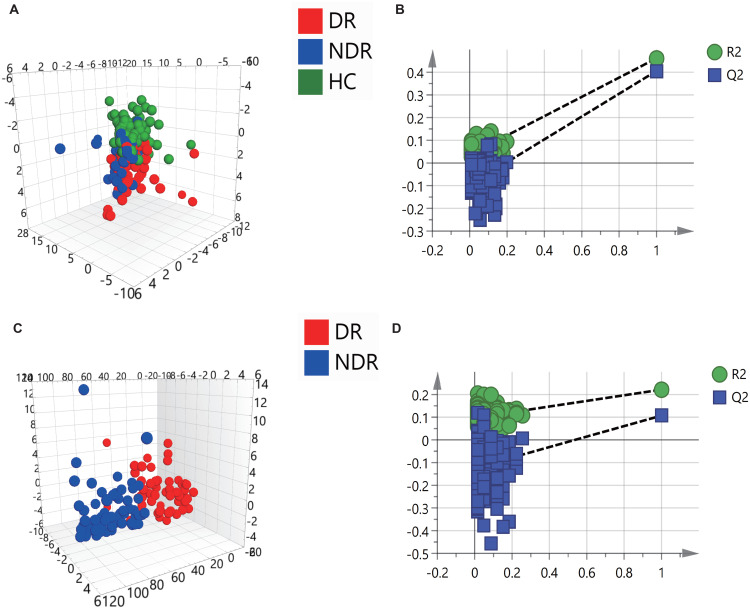
Figure 2.
Metabolomic profiling by targeted metabolomics. (A) OPLS−DA 3D models among HC, NDR, and DR groups. R2X = 0.468, R2Y = 0.310, and Q2Y = 0.253. (B) The 200−permutation test demonstrated no overfitting in the OPLS-DA model [Q2 = (0.0, –0.098)]. (C) OPLS−DA 3D models between NDR and DR groups. R2X = 0.404, R2Y = 0.221, and Q2Y = 0.107. (D) The 200−permutation test demonstrated no overfitting in the OPLS-DA model [Q2 = (0.0, –0.125)].
Abbreviation: OPLS-DA, orthogonal partial least squares-discriminant analysis.

