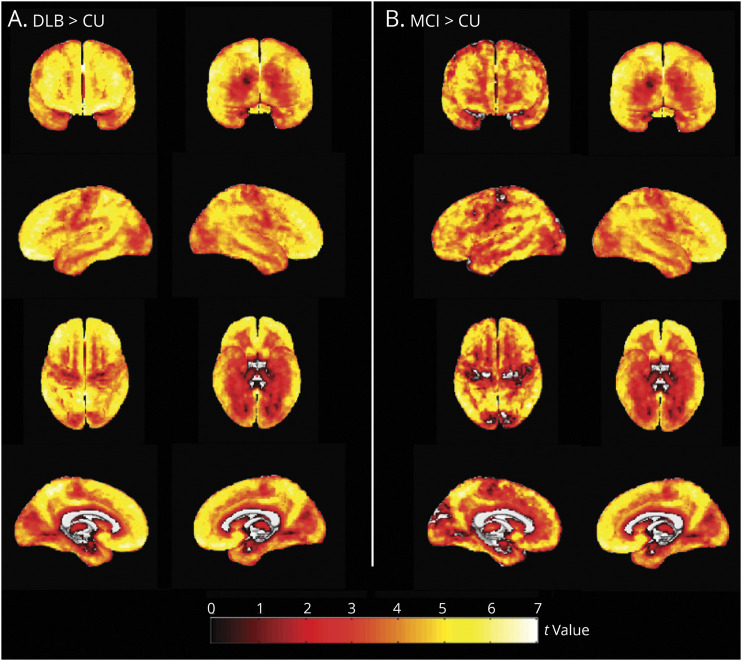
Figure 2. Voxel-Based Analysis Comparing 11C-PiB SUVR in the DLB Continuum.
Maps are displayed at the p < 0.05 level with the t values displayed in the color bar. Correction for multiple comparisons was applied with false discovery rate error correction. CU = cognitively unimpaired; DLB = dementia with Lewy bodies; MCI-LB = mild cognitive impairment with Lewy bodies; PiB = Pittsburgh compound B; SUVR = standardized uptake value ratio.

