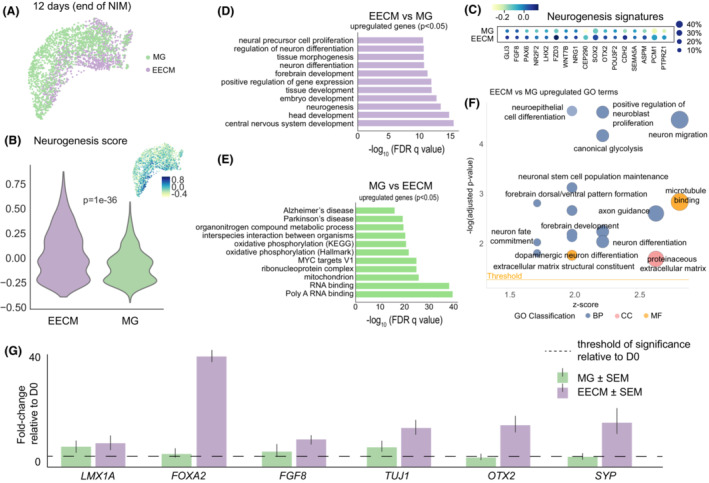
Figure 2.

Comparison of neural lineages by scRNA‐seq in EECMs versus Matrigel after hiPSC‐induction by Neural Induction Medium. (A) Uniform Manifold Approximation and Projection (UMAP) plot visualizes scRNA‐seq of hiPSCs after culturing for up to 5 days in EECMs versus Matrigel (MG) followed by differentiation in NIM for 7 days. (B) A neurogenesis score was calculated for each cell by averaging the expression of a subset of neurogenesis pathway genes (shown in c) subtracted with the average expression of a randomly generated reference gene set. A higher score corresponds to a higher neurogenesis signature. (C) Dotplot of neurogenesis gene expression patterns by expression level (color intensity; blue, high; green, low) and percent of cells from the population expressing those signatures (dot size). (D) and (E) Pathways analysis was performed of genes with adjusted p‐values < 0.05 for the EECM versus Matrigel and Matrigel versus EECM comparisons. (F) Significantly upregulated GO terms for EECM versus Matrigel. Data represent 2843 high‐quality cells taken from pooled EECM or Matrigel sample replicates, n ≥ 3 samples each. (G) qPCR results showing the fold‐change of expression for neural differentiation markers of EECM organoids and Matrigel cultures after 7 days of NIM relative to day 0 (undifferentiated cells); n ≥ 3 biological replicates, that is, three distinct batches of brain organoids, for each gene of interest. All genes are normalized to GAPDH expression levels. BP, biological process; CC, cellular component; EECM, Engineered Extracellular Matrix; FDR, false discovery rate; GO, Gene Ontology; MF, molecular function; MG, Matrigel; NIM, Neural Induction Medium.
