Figure 3.

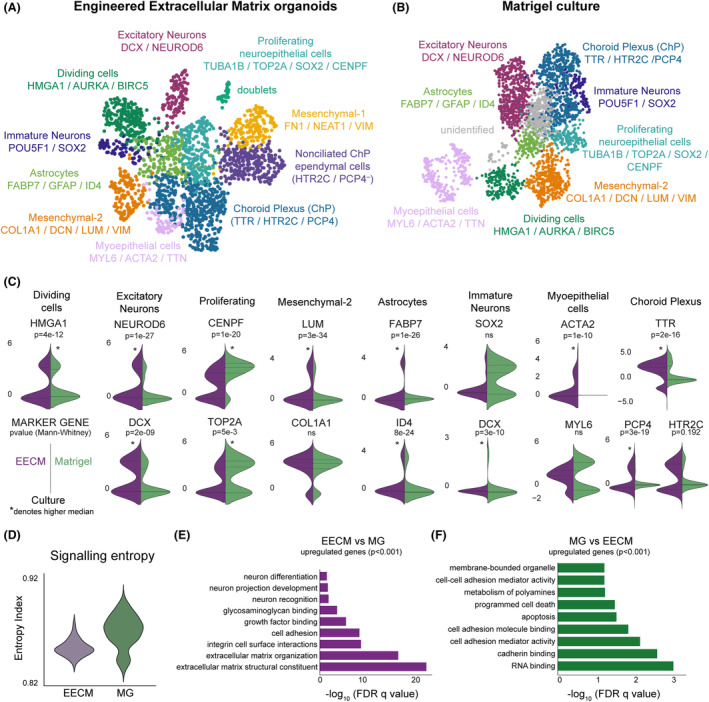
Comparison of organoid maturation and cellular diversity by scRNA‐seq in EECMs versus Matrigel at 47 days. UMAP plots show cellular diversity found in (A) EECM‐supported and (B) Matrigel‐generated brain organoids, using the same cell type annotations and gene markers (listed below cell type annotations). (C) For each cell type shared by EECM and Matrigel, the expression of one to three markers uniquely identifying that population was plotted using violin plots split by group. p‐Values are from a two‐tailed Mann–Whitney U test; the higher median sample values are denoted with an asterisk (*), as determined by alternative, one‐tailed hypothesis testing. (D) Signaling entropy was calculated as previously, using SCENT. 34 A higher entropy index corresponds to higher stemness, that is, lower differentiation. (E, F) Pathway analysis for overall genes upregulated in EECM compared to Matrigel (E) and Matrigel relative to EECM (F) at 47 days of culture. Differentially expressed genes were assessed by a t‐test and only upregulated genes with p < 0.001 were used in this analysis. n = 3 biological replicates per condition, with multiple organoids pooled per biological condition, representing 4393 high‐quality cells. EECM, Engineered Extracellular Matrix; MG, Matrigel; ns, not statistically significant.
