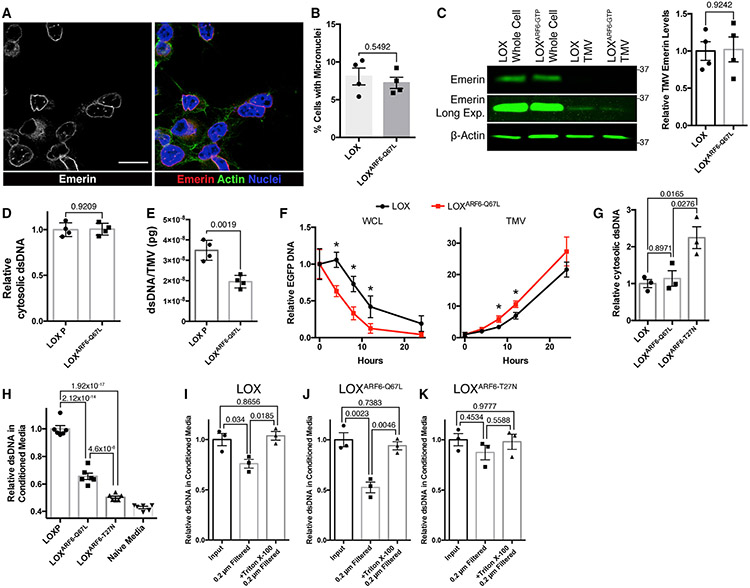
Figure 4. TMVs represent a mechanism of DNA efflux that is independent of micronuclei formation.
(A) LOX cells were fixed and stained for the inner nuclear membrane protein emerin to monitor for the presence of micronuclei. Scale bar, 25 μm.
(B) Percentage of LOX or LOXARF6-Q67L cells containing micronuclei were counted. The data represent 450 cells across 4 independent biological replicates and are presented as means ± SDs. n = 4. The p value was obtained by an unpaired 2-tailed t test.
(C) Whole-cell lysate and TMV lysates were generated from LOX and LOXARF6-Q67L cells. Equal amounts of protein lysates from whole cells and TMVs were then separated by SDS-PAGE and the emerin content was examined by western blotting. The relative TMV emerin content was quantified and graphed. The data are presented as means ± SDs. n = 4. The p value was obtained by an unpaired 2-tailed t test.
(D) Cytosolic DNA was isolated from LOX and LOXARF6-Q67L cells. Isolated DNA was then quantified by Quant-iT high-sensitivity dsDNA assay according to the manufacturer’s instructions. The data are presented as means ± SDs. n = 4. The p value was obtained by an unpaired 2-tailed t test.
(E) DNA isolated from TMVs shed from LOX or LOXARF6-Q67L cells was analyzed by qRT-PCR, and the quantity of DNA per TMV determined by absolute quantitation using control human genomic DNA. The data are presented as means ± SDs. n = 4. The p value was obtained by an unpaired 2-tailed t test.
(F) EGFP cDNA was transfected into LOX or LOXARF6-Q67L melanoma cells actively shedding TMVs. Following incubation with EV-free media for the times indicated, TMVs were isolated as described in Method details, and EGFP DNA within whole cells or TMVs was quantified by qRT-PCR. The data are presented as means ± SDs. n = 3. The p value was obtained by an unpaired 2-tailed t test with Bonferonni’s correction for multiple comparisons.
(G) Cytosolic DNA was isolated from LOX, LOXARF6-Q67L, and LOXARF6-T27N cells. Isolated DNA was then quantified using the Quant-iT high-sensitivity dsDNA kit. The data are presented as means ± SDs. n = 3. The p value was obtained by ANOVA with Sidak’s correction for multiple comparisons.
(H) Total dsDNA content was measured in media conditioned by LOX, LOXARF6-Q67L, and LOXARF6-T27N cells, following 24-h incubation in EV-free media. DNA quantification was determined by the Quant-iT high-sensitivity dsDNA kit. The data are presented as means ± SDs. n = 6. The p value was obtained by ANOVA with Sidak’s correction for multiple comparisons.
(I–K) Total dsDNA content was measured in media conditioned by LOX, LOXARF6-Q67L, and LOXARF6-T27N cells, following 24-h incubation in EV-free media. BeforeDNA quantification, media was subjected to 0.2 μm filtration alone or following 60-min incubation with 0.1% Triton X-100. DNA was then quantified by the Quant-iT high-sensitivity dsDNA kit and relative amounts of dsDNA were graphed. For each panel, the data are presented as means ± SDs. n = 3. The p value was obtained by ANOVA with Sidak’s correction for multiple comparisons.

