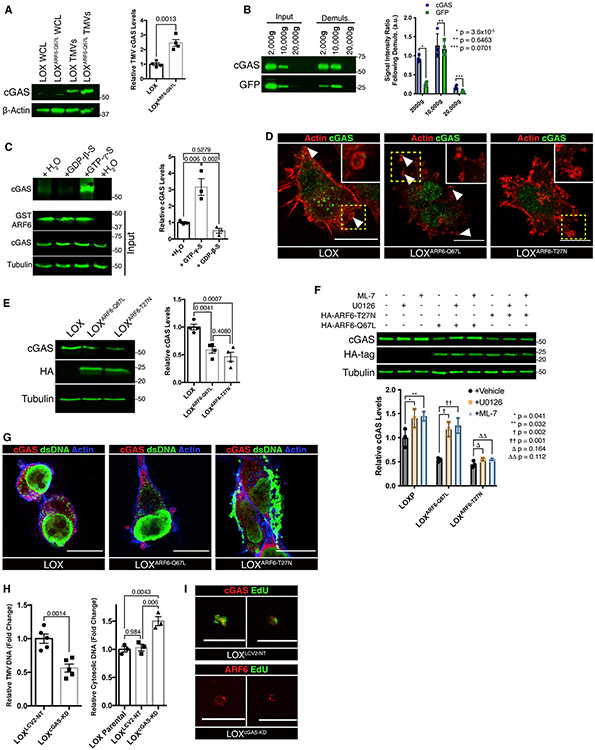
Figure 5. ARF6 and cGAS coordinate DNA delivery to TMVs.
(A) TMVs were isolated from LOX and LOXARF6-Q67L cells and lysed. Equal amounts of TMV protein were separated by SDS-PAGE and probed for cGAS content by western blotting. Relative TMV cGAS levels were quantified and graphed. The data are presented as means ± SDs. n = 4. The p value was obtained by an unpaired 2-tailed t test.
(B) Equal numbers of large EVs were divided, with half being subjected to demulsification to monitor for the presence of cGAS liquid phase droplets. Following repeated cycles of freezing and heating, vesicle pellets were re-isolated and both cGAS and cytosolic GFP levels were examined by western blotting. The data are presented as means ± SDs. n = 3. The p value was obtained by an unpaired 2-tailed t test.
(C) cGAS preferentially binds active, GTP-bound ARF6 in vitro. Recombinant GST-WT-ARF6 conjugated beads were incubated with melanoma cell lysate in the presence of 100 μM GTP-γ-S, 1 mM GDP-β-S, or vehicle control, for 60 min at 37° C. Bound proteins were then precipitated, separated by SDS-PAGE for western blotting, and relative amounts of co-precipitating cGAS were quantified. The data are presented as means ± SDs. n = 4. The p value was obtained by ANOVA with Sidak’s correction for multiple comparisons.
(D) Immunofluorescence was used to examine the localization of endogenous cGAS in LOX, LOXARF6-Q67L, and LOXARF6-T27N cells. In parental and LOXARF6-Q67L cells, cGAS can be found at the cell periphery, where it is incorporated into shedding TMVs. Scale bars, 15 μm.
(E) Equal amounts of whole-cell lysate from LOX, LOXARF6-Q67L, and LOXARF6-T27N cells were separated by SDS-PAGE, and relative amounts cGAS were quantified by western blotting. The data are presented as means ± SDs. n = 4. The p value was obtained by ANOVA with Sidak’s correction for multiple comparisons.
(F) Whole-cell lysates from LOX, LOXARF6-Q67L, and LOXARF6-T27N cells treated for 6 h with ML-7, U0126, or vehicle control were separated by SDS-PAGE, and relative amounts of cGAS were quantified by western blotting. The data are presented as means ± SDs. n = 3. The p value was obtained by ANOVA with Sidak’s correction for multiple comparisons.
(G) Endogenous cGAS and dsDNA were examined by immunofluorescence. Dominant inhibition of ARF6 by ARF6(T27N) expression results in the accumulation of large, intracellular puncta containing both dsDNA and cGAS. Imaging parameters result in the overexposure of intracellular aggregates in LOXARF6-T27N cells. See Figure S5D for alternate exposure. Scale bars, 15 μm.
(H) Total dsDNA content was measured in TMVs isolated from LOXLCV–NT or LOXcGAS–KD cells (left), or from cytosol of LOX, LOXLCV–NT, or LOXcGAS–KD cells (left). DNA quantification was determined by the Quant-iT high-sensitivity dsDNA kit. The data are presented as means ± SEMs. n = 5 (TMVs) or 3 (cytosol). The p value was obtained by t test (TMVs) or ANOVA with Sidak’s correction for multiple comparisons (cytosol).
(I) TMVs were isolated from EdU-labeled LOXLCV–NT or LOXcGAS–KD cells and fixed to poly-l-lysine-coated coverslips as described in Method details. TMVs were fixed, stained, and imaged by confocal microscopy. Scale bar, 10 μm.

