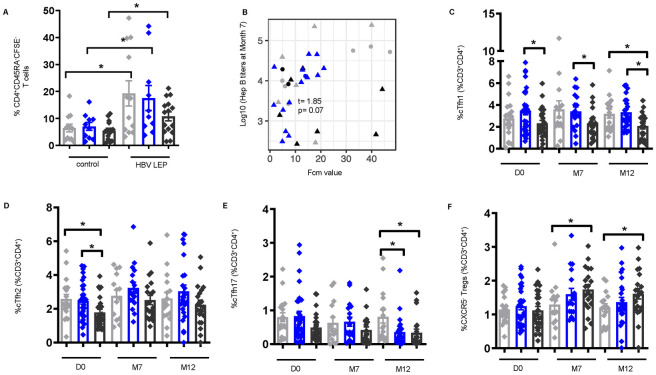
Fig 4. Frequencies of circulating follicular helper (cTfh) cells are lower pre- and post-vaccination in S. mansoni infection with concurrent higher frequencies of regulatory T cells (Tregs) in individuals with high CAA concentration.
(A) Frequencies of CFSE- CD4+CD45RA- memory T (CD4+ mem) cells identified by flow cytometry of PBMCs at M7 post vaccination [non-infected, n = 12, low CAA, n = 10, and high CAA, n = 15] stimulated for 6 days with hepatitis B long envelope protein peptide (HBV LEP) or DMSO control (control). Non-infected- light grey, low CAA—blue, and high CAA—dark grey. Wilcoxon matched-pairs signed rank test performed on control vs. HBV LEP for each non-infected, or low CAA, or high CAA. Data shown as ± SEM. *P ≤ 0.05. (B) Linear regressions fit between Hepatitis B titers and CFSE- CD4+ mem T cells, adjusted for sex, and student t-tests evaluated for the significance of the association. t (t-statistic). P ≤ 0.05 was considered significant. (Shape: triangle-Male, circle-Female; color: grey- non-infected, black- low CAA, blue- high CAA). Frequencies of CD3+CD4+CD45RA-CD25-CXCR5+ populations: (C) cTfh1 [CXCR3+], (D) cTfh2 [CXCR3-CCR6-], (E) cTfh17 [CXCR3-CCR6+], and (F) CXCR5-Tregs [CD3+CD4+CD45RA-CD127-CD25+Foxp3+CXCR5-] identified by flow cytometry of PBMCs pre-vaccination (D0) [non-infected, n = 19, low CAA, n = 31, high CAA, n = 25], M7 post-vaccination [non-infected, n = 14, low CAA, n = 17, high CAA, n = 20], and M12 post-vaccination [non-infected, n = 16, low CAA, n = 24, high CAA, n = 20]. Data shown as ± SEM. *P ≤ 0.05. Wilcoxon rank-sum test performed on non-infected vs. low CAA, or non-infected vs. high CAA, or low CAA vs. high CAA for each time point separately D0, M7, or M12. Non-infected- light grey, low CAA—blue, and high CAA—dark grey.

